
In the previous parts of this blog series about monitoring models with unstructured data, we covered Fiddler’s approach to monitoring high-dimensional vectors, and how this method can be applied to computer vision use cases.
In part 3, we will discuss why monitoring natural language processing (NLP) models is important, and show how Fiddler empowers data scientists and ML practitioners with NLP model monitoring. We will present a multi-class classification example which is built using the 20 Newsgroups dataset and use text embedding generated by OpenAI.
Why is monitoring NLP models important?
Over the past decade, NLP has become an important technology adopted by data-driven enterprises. Investments will continue to pour into NLP solutions to maximize business value from conversational and Generative AI. In general, NLP refers to a group of tools and techniques that enable ML models to process and use human language — as text or audio format — in their workflow. Some examples of NLP use cases include, but are not limited to, text classification, sentiment analysis, topic modeling, and named entity recognition. A wide set of tools and techniques are available today for building NLP models, from basic vectorization and word embeddings (e.g., tf–idf and word2vec) to sophisticated pretrained language models (BERT, GPT-3) to custom-made transformers.
NLP models are vulnerable to performance degradations caused by different types of data quality issues after deployment. Similar to other types of machine learning models, the general assumption for model performance evaluations is that the underlying data distribution remains unchanged between training and production use. This assumption, however, may not always be valid in the real world. For example, a new meme or political topic, fake product reviews generated by bots, or natural disasters and public health emergencies, like the COVID-19 pandemic, are all scenarios in which NLP models may encounter a shift in the data distribution (also known as data drift).
Given the prevalence of NLP data across different industries, from healthcare and ecommerce to fintech, it is important to minimize the risk of model failure and performance degradations by monitoring NLP models. Therefore, NLP model monitoring is becoming an essential capability of any monitoring framework. In response to this need, we have previously launched NLP model monitoring capabilities to the Fiddler AI Observability platform, which enables our customers to gain better visibility of their NLP pipelines, detect any performance and drift issues, and take timely actions to minimize risks that negatively impact their business.
NLP monitoring using Fiddler vector monitoring
Modern NLP pipelines process text inputs in steps. Text is typically converted to tokens, and an embedding layer maps tokens into a continuous space — the first of many vector representations. There are sometimes several representations which can be used for monitoring; we've found that some act as early warnings while those further downstream track actual performance degradation more closely.
Fiddler’s approach to monitoring NLP models is based on directly monitoring the vector space of text embeddings. If desired, Fiddler can monitor multiple vector representations simultaneously for the same text input. In some cases, using simple pre-trained word-level embeddings, like word2vec, or even term frequency (TF-IDF) can provide sufficient sensitivity to semantic shift.
Users can set custom model monitoring alerts to get early warnings on changes in the distribution of vectors which can potentially affect the expected behavior of the model. Examples of such changes include a significant distributional change in the high-dimensional vector embeddings of text data, occurrence of outliers, or out-of-distribution data points at production time.
Fiddler has developed a novel clustering-based approach to monitor the vector embedding spaces. This approach identifies regions of high-density (clusters) in the data space using a baseline dataset, and then tracks how the relative density of such regions changes at production time. In fact, clustering of data space is used as a novel binning procedure in high-dimensional spaces. Once a binning is available, a standard distributional distance metric such as the Jensen-Shannon distance (JSD) or the population stability index (PSI) can be used for measuring the discrepancy between production and baseline histograms.
To learn more about Fiddler’s clustering-based vector monitoring algorithm, read part 1 of this blog series.
Example: Data drift monitoring for a multi-class classification NLP model
In the following example, we will demonstrate how data scientists can use Fiddler to monitor a real-world NLP model. We will use the 20 Newsgroups public dataset which contains labeled text documents from different topics. We will also use OpenAI embeddings to vectorize text data, and then train a multi-class classifier model that predicts the probability of each label for a document at production.
First we need to vectorize the text data. OpenAI has recently published its latest text embedding model, text-embedding-ada-002, which is a hosted large language model (LLM) and outperforms its previous models. Furthermore, Open AI embedding endpoints can be easily queried via its Python API, which makes it an easy and efficient tool for organizations who want to solve NLP tasks quickly.
We will keep the classification task simple by grouping the original targets into five general class labels: 'computer', 'for sale' 'recreation', 'religion', and 'science'. Given the vectorized data and class labels we train a model using a training subset of the 20 Newgoups dataset.
General class labels used in this example:
- Computer
- For Sale
- Recreation
- Religion
- Science
For monitoring purposes, we typically use a reference (or baseline) dataset with which to compare subsequent data. We create a baseline dataset by randomly sampling 2500 examples from the five subgroups specified in the 20 Newsgroup dataset.
To simulate a data drift monitoring scenario, we manufacture synthetic drift by adding samples of specific text categories at different time intervals in production. Then we will assess the performance of the model in Fiddler and track data drift at each of those time intervals.
Now we present how Fiddler provides quantitative measures of data drift in text embeddings via Fiddler Vector Monitoring. This capability is designed to directly monitor the high-dimensional vector space of unstructured data. Therefore, NLP embedding models such as OpenAI can be easily integrated into Fiddler and users can start monitoring them without any additional work. All the user needs to do is to specify the input columns to a model that correspond to the embeddings vectors. This can be done by defining a "custom feature" for NLP embeddings using the Fiddler client API.
Figure 1 shows the data drift chart within Fiddler for the 20 Newsgroups multi-class model introduced in this blog. More specifically, the chart is showing the drift value (in terms of JSD) for each interval of production events, where production data is modified to simulate data drift. The call outs show the list of label categories from which production data points are sampled in each time interval.
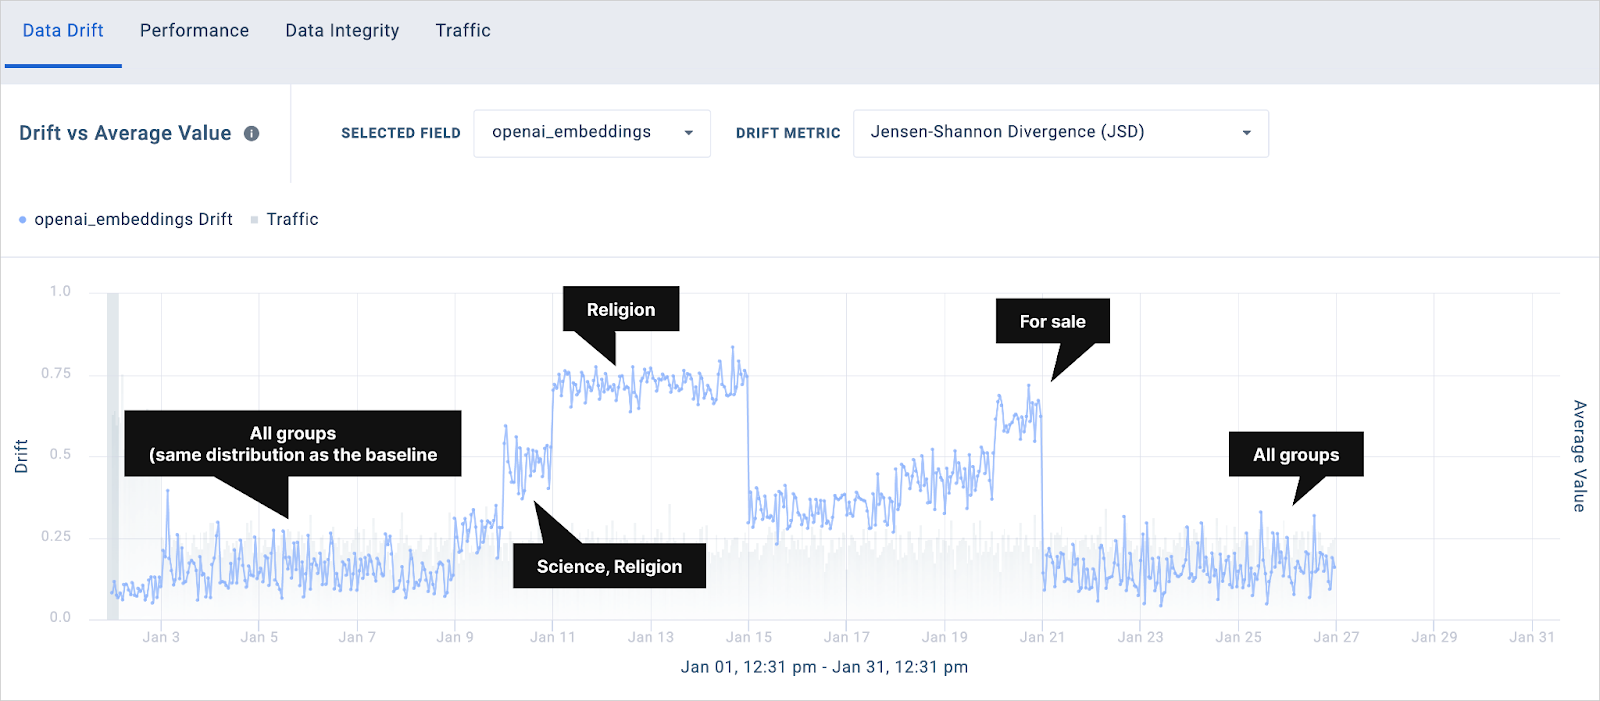
The baseline dataset contains samples from all categories and the initial intervals with low JSD value correspond to production data which is sampled from all categories as well (i.e., same data distribution as the baseline). In the subsequent intervals, samples are drawn from more specific groups of labels as shown in each call out. We see that the JSD value has increased as the samples are drawn from more specific categories, which indicates a change in the data distribution. For instance, we see that the JSD value for the intervals that contain samples from the ‘science’ and ‘religion’ groups has increased to around 0.5, and the following interval that only contains samples from the ‘religion’ group demonstrates a drift value of 0.75. There is a drop back down to the baseline in the JSD value when all categories were added to the samples.
You can use this notebook to follow the details on how to monitor this example in Fiddler.
Gaining more insights into data drift using UMAP visualization
In the monitoring example presented above, since data drift was simulated by sampling from specific class labels, we could recognize the intervals of large JSD value and associate them with known intervals of manufactured drift. However, in reality, oftentimes the underlying process that caused data drift is unknown. In such scenarios, the drift chart is the first signal that is available about a drift incident which can potentially impact model performance. Therefore, providing more insight about how data drift has happened is an important next step for root cause analysis and maintenance of NLP models in production.
The high-dimensionality of OpenAI embeddings (the ada-002 embeddings have 1536 dimensions) makes it challenging to visualize and provide intuitive insight into monitoring metrics such as data drift. In order to address this challenge, we use Uniform Manifold Approximation and Projection (UMAP) to project OpenAI embeddings into a 2-dimensional space while preserving the neighbor relationships of the data as much as possible.
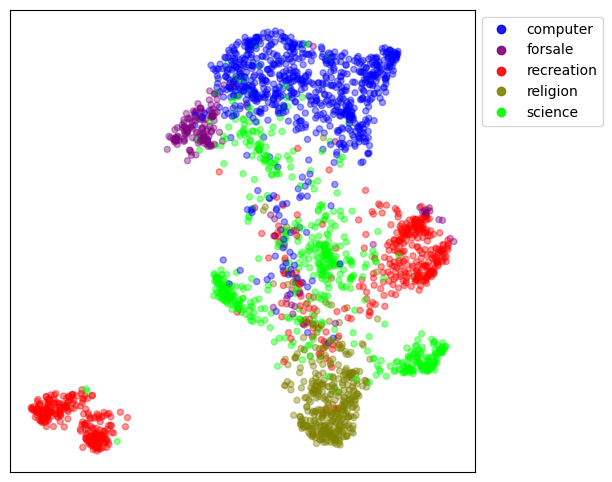
Figure 2 shows the 2D UMAP visualization of the baseline data colored by class labels. We see that the data points with the same class labels are well-clustered by UMAP in the embedded space although a few data points from each class label are mapped to areas of the embedded space that are outside the visually recognizable clusters for that class. This is likely due to the approximation involved in mapping 1536-dimensional data points into a 2D space. It's also plausible that ada-002 has identified semantically distinct subgroups within topics.
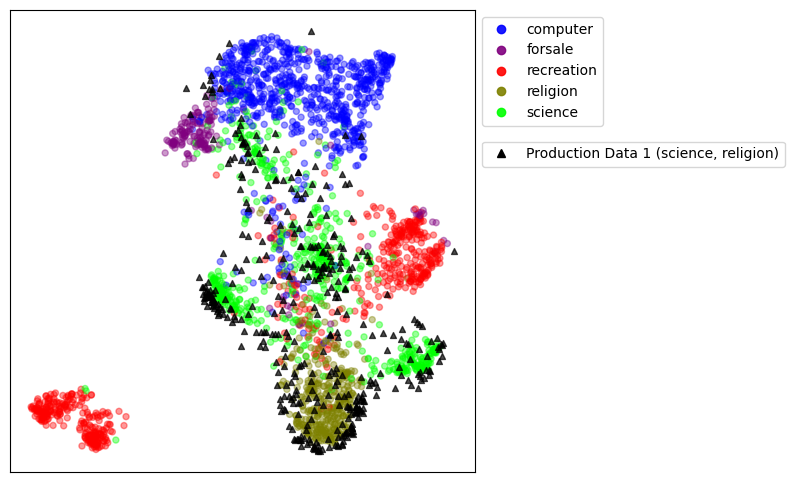
In order to show how UMAP embeddings can be used to provide insight about data drift in production, we will take a deeper look at the production interval that corresponds to samples from “science” and “religion” categories. Figure 3 shows the UMAP projection of these samples into the UMAP embeddings space that was created using the baseline samples. We see that the embedding of unseen data is aligned fairly well with the regions that correspond to those two class labels in the baseline, and a drift in the data distribution is visible when comparing the production data points and the whole cloud of baseline data. That is, data points are shifted to the regions of space that correspond to “science” and “religion” class labels.
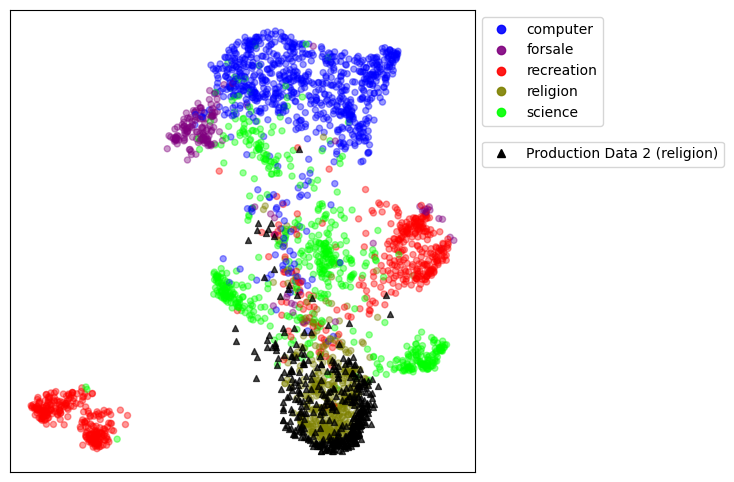
Next, we perform the same analysis for the interval that contains samples from the “religion” category only, which showed the highest level of JSD in the drift chart in Figure 1. Figure 4 shows how these production data points are mapped into the UMAP space; indicating a much higher drift scenario.
Notice that although UMAP provides an intuitive way to track, visualize and diagnose data drift in high-dimensional data like text embeddings, it does not provide a quantitative way to measure a drift value. On the other hand, Fiddler’s novel clustering-based vector monitoring technique provides data scientists with a quantitative metric they can use to measure drift accurately and assign alerts to appropriate thresholds.
Interested in using Fiddler’s cluster-based approach to monitor your NLP models? Contact us to talk to a Fiddler expert!