
Introduction
Gartner estimates that unstructured data accounts for over 80% of all new enterprise data. Companies are increasingly tapping into this potential with machine learning, especially deep learning. Natural Language Processing (NLP) solutions and services particularly experienced unprecedented acceleration over the last few years with a projected growth of over 25% through this decade. Computer vision (CV) is also seeing steady growth led by the industry.
The underlying assumption of statistical ML is that data distribution remains the same during training and deployment. Violating this assumption often results in unexpected behaviors, such as decay in model performance. Therefore, data drift detection and monitoring for distributional shifts in the data are essential parts of any model monitoring platform.
At Fiddler, we see a growing need amongst our customers for operational visibility in models with complex unstructured data that they are increasingly deploying.
While data drift detection is a relatively well studied problem for the case of univariate tabular data, it becomes a challenging problem when facing unstructured data such as text or image inputs, which are usually represented as high-dimensional vectors.
The common approach to data drift detection for structured data involves estimating univariate distributions using binned histograms and applying standard distributional distance metrics such as Jensen-Shannon divergence (JSD) to measure drift in production data compared to a baseline distribution. Using standard model drift metrics is not directly applicable to the case of high-dimensional vectors that represent unstructured data because the binning procedure in high-dimensional spaces is a challenging problem whose complexity grows exponentially with the number of dimensions.
Furthermore, monitoring vector elements individually is not enough since we are usually interested in detecting distributional shifts of high-dimensional vectors as a whole, rather than marginal shifts in vector elements. For example, when monitoring image data or TF-IDF text embeddings, drift monitoring for a single image pixel or a single TF-IDF keyword does not provide much useful insight.
We have developed a novel patent-pending method for monitoring distributional shifts in high-dimensional vectors. This method is not only sensitive to detecting drift, but also enables data scientists to know how the drift has happened.
At a high level, Fiddler solves the multi-dimensional binning problem using an intuitive clustering approach: detect regions of high density (clusters) in the data space, and track how the relative density of such regions might change at production time.
As a naive alternative approach to approximating drift in high-dimensional spaces, one may look at the shift in the mean value of the production data compared to the baseline data. This can be calculated using the Euclidean distance between the two average vectors. This approach however has certain limitations. First, one cannot capture the changes in the data distribution by only looking at the mean shift. In particular, we might have a scenario where the shape of data distribution is changed significantly while the average vectors stay almost unchanged. Furthermore, while detecting a shift in the mean indicates data drift it does not answer the question of “how” that drift has happened. Thus, it doesn’t provide the insights needed by data scientists for debugging.
Finally, using our clustering-based binning approach we get a drift value that is in terms of standard distributional distance metrics such as JSD or PSI. These drift values are consistent with univariate drift values and are much more intuitive compared to say a general metric such as Euclidean distance.
Fiddler’s approach to unstructured model monitoring
We want to enable MLOps teams to easily and accurately identify data drift for all types of unstructured data including text, image, embedding vectors, etc. At the foundational level, these unstructured data types are usually represented as multi-dimensional vectors so that they can be used as inputs to ML models. The vector representation is generally achieved through a transformation step often called “vectorization”. For example in NLP use cases, text data is first transformed into an embedding space of high-dimensional vectors using embedding methods such as TF-IDF or more advanced language models. Note that some ML models like DNNs may integrate the vectorization step with the prediction pipeline, where the embedding vectors are created internally.
Consequently, monitoring unstructured data boils down to the capability of tracking distributional shifts in multi-dimensional vector spaces. To solve this problem comprehensively, our approach to monitoring NLP and CV models is to monitor the vectors that represent the underlying data with Vector Monitoring (VM).
At Fiddler, we adapt a novel clustering-based approach for VM, and calculate a drift value that indicates how much the data distribution has changed in a particular time period compared to a baseline data. Tracking this drift value over time, practitioners will know when the performance of their unstructured data models might drop due to a change in the underlying data distribution.
The clustering-based drift detection method
In order to apply distributional distance metrics such as JSD in practice, one needs to first find a histogram approximation of the two distributions at hand. In the case of univariate tabular data (i.e., one dimensional distributions), generating these histograms is fairly straightforward and is achieved via a binning procedure where data points are assigned to histogram bins defined as a particular interval of the variable range.
However, working with vector representations of unstructured data, the above binning procedure is not practical since the number of bins can easily explode as the number of dimensions increases. Therefore, the main challenge in monitoring vector data is finding an efficient binning procedure for multi-dimensional vector distributions.
The core idea behind Fiddler vector monitoring is a novel binning procedure in which instead of using fixed interval bins, bins are defined as regions of high-density in the data space. The density-based bins are automatically detected using standard clustering algorithms such as k-means clustering. Once we achieve the histogram bins for both baseline and production data, we can apply any of the distributional distance metrics used for measuring the discrepancy between two histograms.
Now we present an illustrative example (Figure 1) that describes each step of the Fiddler VM algorithm. For the sake of simplicity, consider the example in the following figure where the vector data points are 2-dimensional.
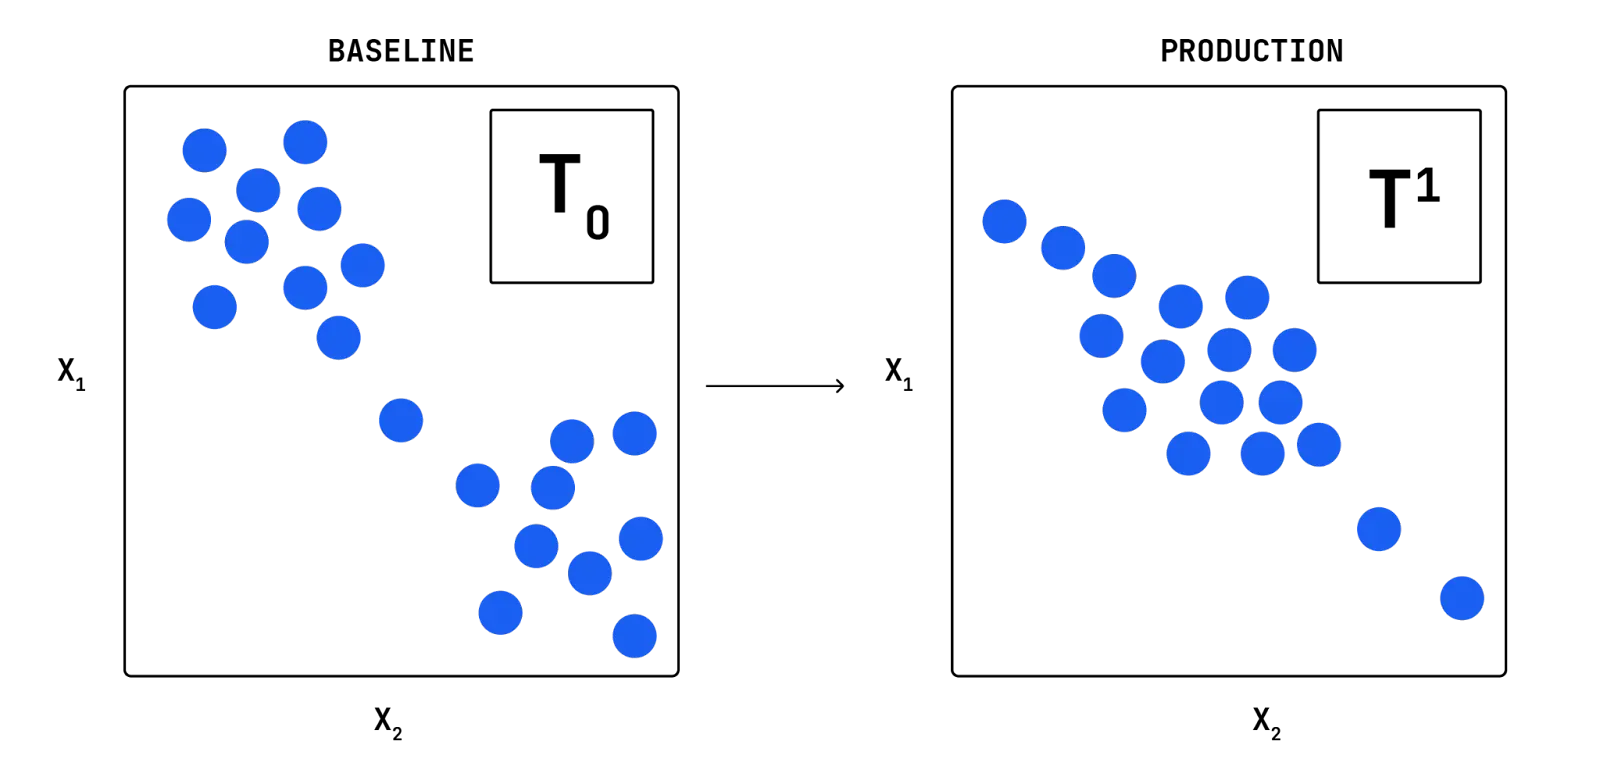
Comparing the baseline data (left plot) with the example production data (right plot), we see a shift in the data distribution where more data points are located around the center of the plot. Note that in practice the vector dimensions are usually much larger than 2 and such a visual diagnosis is impossible. Moreover, we would like to have an automatic procedure that precisely quantifies the amount of data drift at a given time.
The first step of Fiddler’s clustering-based drift detection algorithm is to detect regions of high density (data clusters) in the baseline data. We achieve this by taking all the baseline vectors and partitioning them into a fixed number of clusters using a variant of the K-means clustering algorithm.
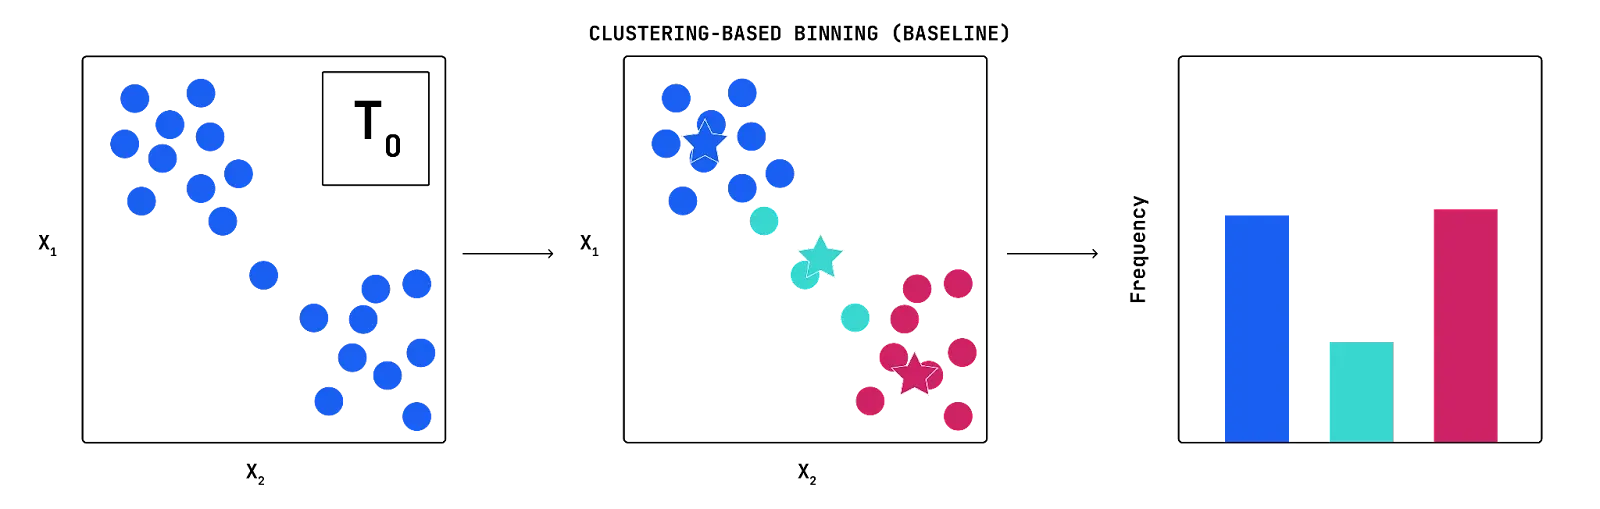
For example, Figure 2 shows the output of the clustering step (k=3) applied to our illustrative example where data points are colored by their cluster assignments.
After baseline data are partitioned into clusters, the relative frequency of data points in each cluster (i.e., the relative cluster size) implies the size of the corresponding histogram bin. As a result, we obtain a 1-dimensional binned histogram of high-dimensional baseline data.
As we mentioned earlier, our goal is to monitor for shifts in the data distribution via tracking how the relative data density changes over time in different partitions (clusters) of the space. Therefore, the number of clusters can be interpreted as the resolution by which the drift monitoring will be performed; the higher the number of clusters, the higher the sensitivity to data drift.
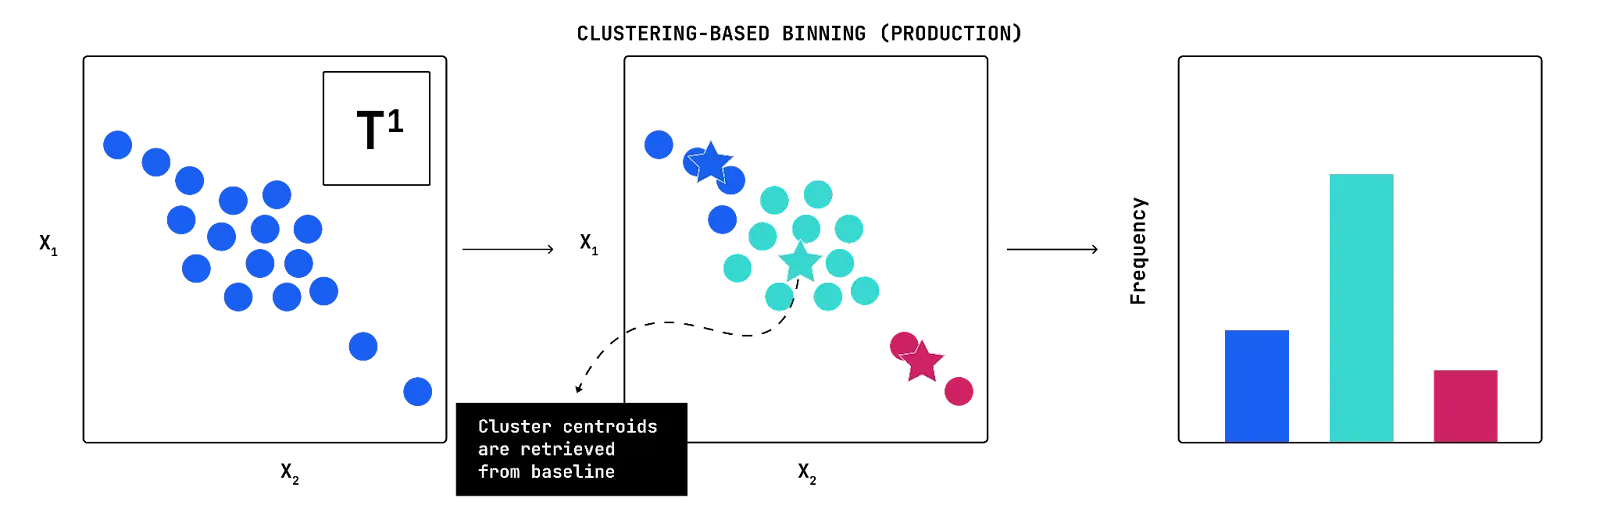
After running K-means clustering on the baseline data with a given number of clusters K, we obtain K cluster centroids. We use these cluster centroids in order to generate the binned histogram of the production data. In particular, fixing the cluster centroids detected from the baseline data, we assign each incoming data point to the bin whose cluster centroid has the smallest distance to the data point. Applying this procedure to the example production data previously shown in Figure 1 and normalizing the bins, we obtain the following cluster frequency histogram for the production data (Figure 3).
Finally, we can use a conventional distance measure like JSD between the baseline and production histograms to get a final drift metric as shown in Figure 4. This drift metric helps identify any changes in the relative density of cluster partitions over time. Similar to univariate tabular data, users will get alerted when there is a significant shift in the data the model sees in production.

Conclusion
Organizations must consider how to monitor unstructured data as they deploy models such as NLP and CV whose inputs are not in a structured tabular format. The common method of estimating univariate distributions using binned histograms and applying standard distributional distance metrics is not applicable for measuring data drift in unstructured data. Unstructured data inputs like text and image, are usually represented as high-dimensional vectors. Fiddler’s clustering-based drift monitoring algorithm uses a novel binning procedure that reduces the problem of drift detection in high-dimensional spaces to 1-dimensional histograms drift detection. This method enables teams to increase their monitoring power when measuring drift models such as NLP and CV.
We demonstrate how Fiddler's unstructured model monitoring works with a series of examples in Part 2 of this blog series. In the meantime, contact us to see how you can benefit from our NLP and CV monitoring.