Analytics: Actionable Insights for the Most Complex Models

Ready to wrangle time and space with slice and compare?
Say you want to understand outcomes at any given point in time. The Fiddler AI Observability platform enables you to access past, present, and future model outcomes, providing the best way to mitigate risk.
You can also slice and compare model performance metrics across point predictions, as well as regional and global data.
Open up revenue and growth with high ROI models
Yes, ML models can help reduce costs, but they are also brilliant at uncovering market opportunities and exposing new ways to attract customers. The key is to deploy higher ROI models that deliver more actionable insights and stronger outputs, thanks to the right inputs.
Fiddler empowers you to unlock new revenue opportunities by validating and deploying even the most complex data modeling examples.
- Understand the causal drivers of model outputs behind business decisions.
- Increase financial savings from improved types of analytical modeling.
- Understand the business impact of an ineffective model early.
Decision making powered by sound actionable insights and rich charting
Everyone wants to make decisions based on descriptive and prescriptive analytics derived from ML models. However, the value of ML models decreases rapidly when they don’t reflect the actual needs and challenges of the business. Relevant market and business dynamics must be included.
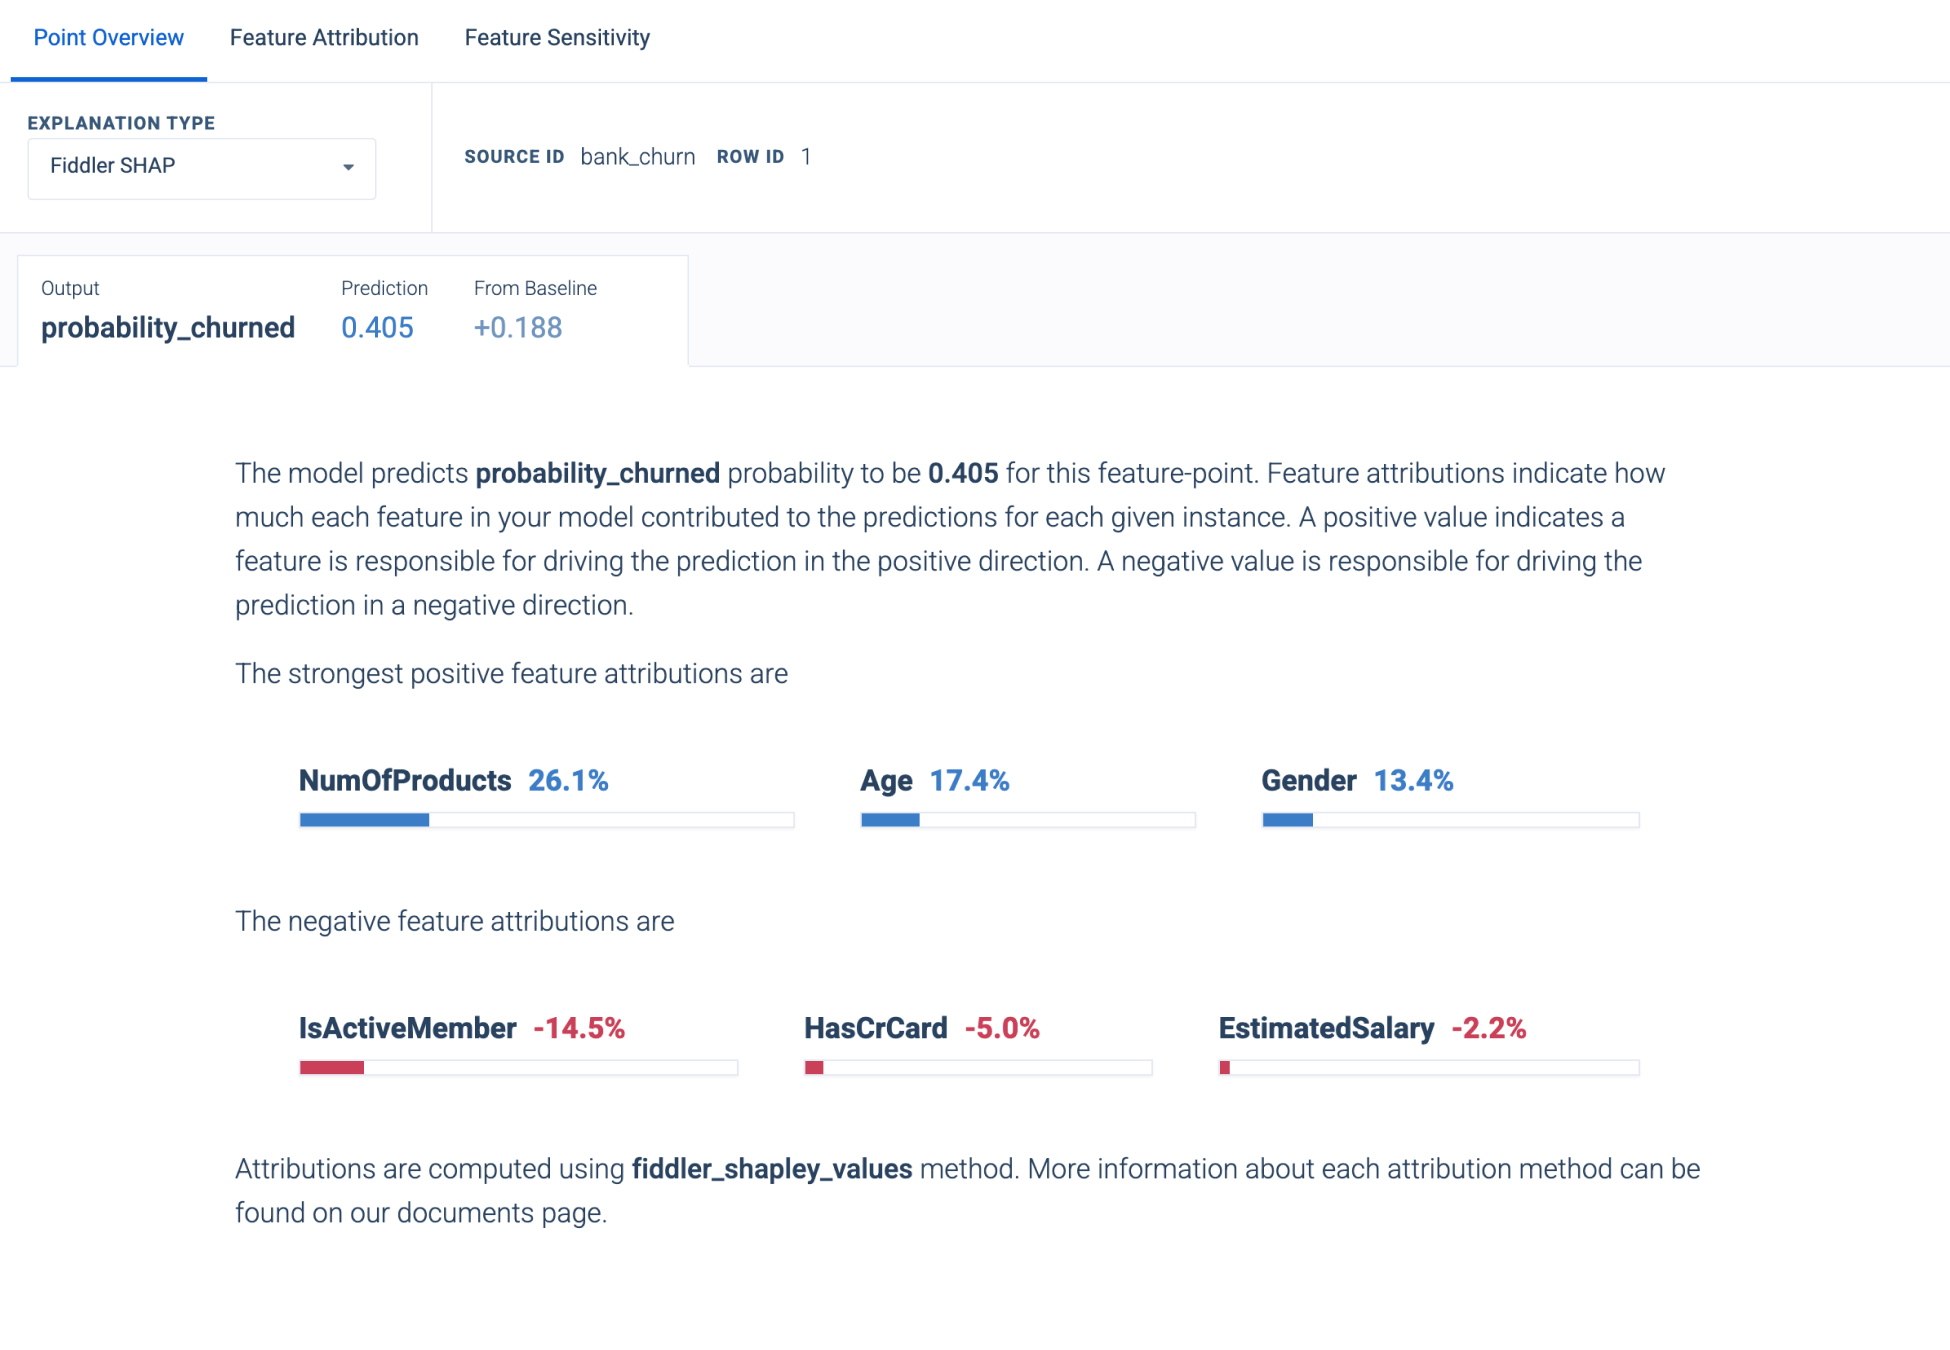
Fiddler allows you to understand the causal drivers of the model outputs behind business decisions and to explain decision-making factors. Best of all, it’s simple to share information with key stakeholders using a rich set of dashboards, charts, and reports.
- Use explainable AI to drill deep into multiple facets of feature impact and importance for your business.
- Understand and explain to stakeholders how ML models make decisions.
- Troubleshoot issues with training data and prediction logs stored in a single location.

Measure the impact of what-if analyses on training and production models
Whenever market dynamics shift (and they always do), it’s important to recognize changes early, understand the business impact of an ineffective model, and update models with speed and efficiency.
Fiddler enables you to perform what-if analysis, test new theories and data modeling concepts, and return predictions with altered inputs. With predictive modeling techniques, you can conduct fast analyses that compare features within models and measure possible impacts on training and production data — without ever leaving the platform.
- Compare champion-challenger models in real-time to understand model variation.
- Plot multiple performance metrics in one chart to understand their correlation and impact model behavior.
- Understand how different baselines, data shifts caused by time, seasonality or geography, influence model drift.
- Watch for leading indicators of problems with canary traffic.
- Use time travel to roll back models, data, and code (with all dependencies).
Analytics features
Dashboards
Increase business alignment and confidence in decision-making by enabling teams across the organization to glean insights and connect ML metrics to business KPIs in a unified view
Charts
Build custom reports with the insights you need to gain deep understanding of your models and their impact on business outcomes, from monitoring metrics, feature impact, correlation, and distribution to partial dependence plot (PDP) charts
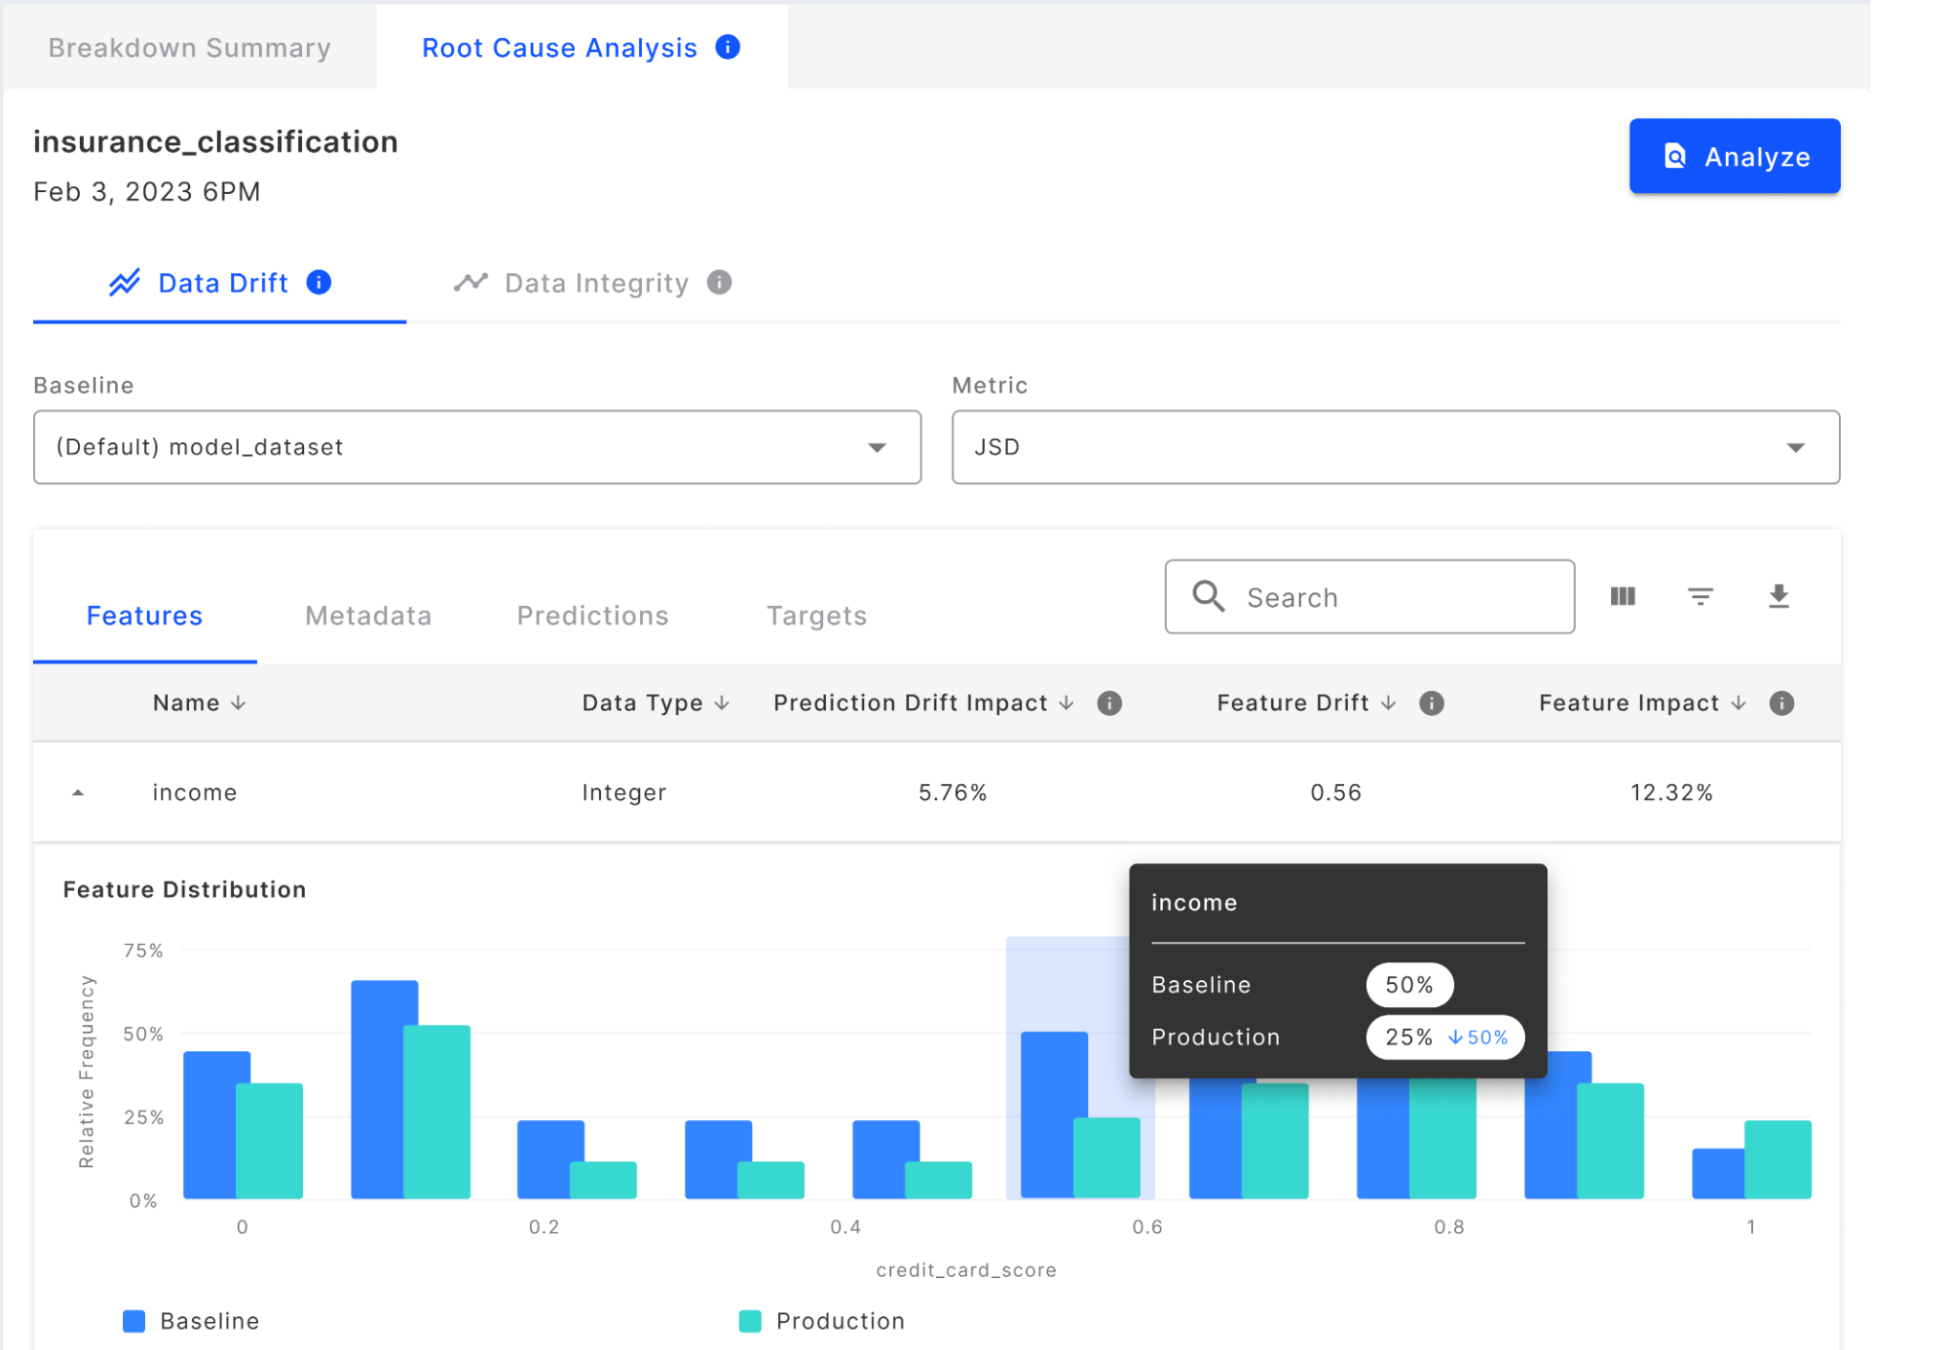
Root cause analysis
Drill down on problem areas to uncover the root cause of underperforming segments
Slice and explain
Drill down into specific segments to perform exploratory or targeted analysis, and find underperforming cohorts
Model validation
Evaluate your model’s performance and validate it before deploying it into production
Frequently Asked Questions
What is ML analytics?
ML analytics helps organizations understand and optimize the business impact of their machine learning models by evaluating performance data, identifing patterns, and generating actionable insights. An ML analytics solution enables teams to compare models in real-time, drill down into problem areas to uncover root causes of underperformance, and build custom reports that connect ML metrics to core business KPIs.
How can ML analytics help improve business outcomes?
ML analytics enables organizations to understand the decision-making processes behind model outputs, and generate actionable insights for optimizing ML models to drive business outcomes and ROI. It increases business alignment by enabling teams to connect ML metrics to business KPIs in a unified view and drill down on problem areas to uncover the root cause of underperforming segments.
What is the difference between ML monitoring and analytics?
Monitoring provides real-time visibility into how AI and ML models are performing — tracking metrics like drift, latency, and data quality. Analytics, on the other hand, interprets that data to generate insights, uncover root causes, and guide business decisions. Both are essential: monitoring detects issues early, while analytics provides explanations and helps AI engineers resolve them.
