Monitoring human health and ML model health can be quite similar. Most patients schedule annual exams to assess their health, potentially identifying a new concern or illness. Those who have known maladies are usually prescribed routine tests to continuously measure their progress — has the illness improved or has the patient relapsed? — and benchmark their results to the reference range. If the test results are higher or lower than the reference range, doctors need to conduct a closer diagnosis to find the root cause behind the symptoms in order to treat the patient back to health.
But understanding the cause for spikes and dips in test results can be complex. After all, the test results are mere numbers that indicate the patient’s current state. Those scores can be affected by multiple factors, including environmental changes like diet, current dwelling, or even places recently visited.
Similar to human diagnosis by medical teams, MLOps teams must be able to roll back time to find where the issue appeared, diagnose the underlying factors that led to performance degradation, and take necessary actions to treat the models back to health.
ML models need to be continuously monitored to ensure they’re “healthy” and provide the most accurate predictions to end-users.
Diagnose and resolve model issues with root cause analysis
At Fiddler, we believe that an enterprise AI Observability platform needs to go beyond model metrics to provide actionable insights and help resolve model issues. Using our recently launched dashboards and charts, teams can continuously improve model outcomes, creating a feedback loop in their MLOps lifecycle. By implementing human-centered design principles in our model monitoring alerts and root cause analysis, we’ve made it easier than ever for teams to identify the real reasons behind model issues.
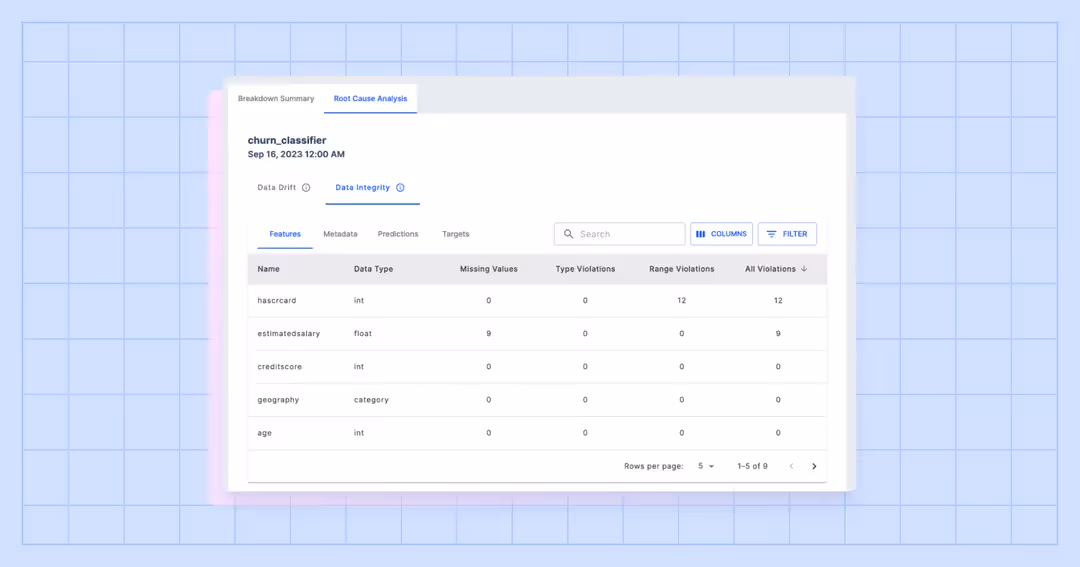
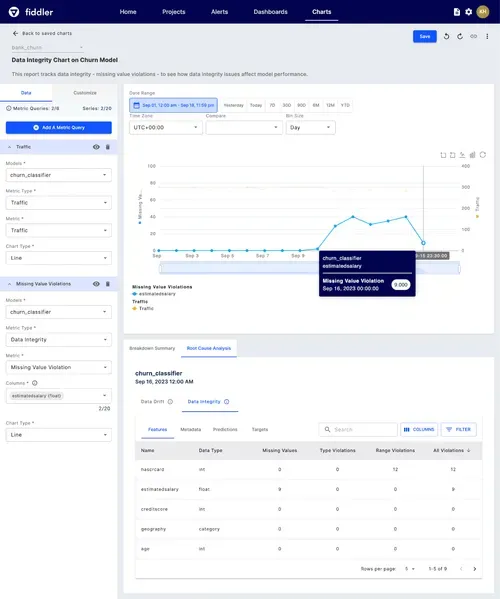
ML practitioners perform root cause analysis by first zooming in on issues they’ve identified on the monitoring charts and diagnose model issues to draw contextual information, so they can be more prescriptive on where and how to improve model predictions. They can perform root cause analysis on a model(s) and metric type (ie. performance, drift, or data integrity) in any specified period of time.
Examining model issues with feature impact and importance
Let’s say a model for a product recommendation engine in your eCommerce website is underperforming during a Back-to-School campaign. Your ML team can visualize the drop in model performance by zeroing in on the time that the performance started to fall. By performing the root cause analysis on that period in time, you can check for model drift. Seeing high model drift tells you something about your production data has changed but it doesn’t tell you how it changed.
On the Fiddler platform, you can identify the top features that contributed the most to prediction drift and had the highest impact on the model’s predictions. Then you can further diagnose the underlying cause of the issue by analyzing features, metadata, predictions and/or targets and compare their distribution. For example, you can visualize the feature distribution of a particular feature by comparing its production data and baseline data to see exactly how the feature has changed.
In the case of the Back-to-School campaign, the model used in production during the campaign was trained using last year’s Back-to-School time data. As a result, the model was recommending products, like backpacks, lunch bags, and school supplies, that parents would purchase at the start of the school year. As the campaign progresses, the recommendation model starts underperforming.
At first glance, you’ll see the highest drift score in the feature purchased_item but it doesn’t tell you how or why it is the biggest culprit to the model’s underperformance. This is where Fiddler comes in and helps you connect the dots between poor model performance and purchased_item. By looking at the feature distribution, you find out that the purchasing behavior has changed with customers buying more licensed sports gear. This purchasing behavior is a new trend that was not present in last year’s dataset and it is impacting the model’s recommendations. This insight indicates that the recommendation model should be retrained so that it continues to recommend back-to-school products as well as sports gear that customers would be interested in purchasing.
Now let’s talk about another feature may be used to train the model. If the feature recently_viewed_products drifts, then it will impact the model’s recommendation and performance since customers are viewing products that the model wasn’t trained on. This is an indication to diagnose how exactly the model drifted by analyzing the feature distribution to retrain or fine tune to the model.
In some cases, model issues aren’t caused by performance or drift. Data integrity issues are often overlooked whenever model issues come up. We always ask our customers to use Fiddler to assess whether the model performance was affected by a data integrity issue like broken data pipelines or missing values — a rather easy fix that doesn’t require model tuning or retraining.
You can use Fiddler’s enhanced charting experience to continue monitoring the model behind your product recommendation engine. For example, you can plot multiple baselines to compare them against production to understand which baselines influence drift (ie. baseline vs Back-to-School production data), and chart multiple metrics in a single chart — up to 6 metrics and 20 columns — for advanced analytics like champion vs. challenger model comparisons.
Chat with our AI experts to learn how to use Fiddler’s root cause analysis to diagnose the health of your models for your unique AI use case. Book a demo now!