
The central goal of machine learning models is to go from a small example set (training data) to a broader generalization (production data). To do so they rely on the flawed assumption that input data distribution does not drift away too much over time; but we know all models eventually degrade in performance. Therefore, for successful ML model deployment, MLOps teams need continuous model monitoring to detect drift when it occurs and explainability to understand what caused it.
What is distributional drift?
In real-world deployment, input data can unexpectedly vary from what models were trained on, potentially resulting in drastic consequences. So how can we make sense of this uncertainty? That’s where standard statistical distributions come in. If we can approximately assume that our data comes from a certain distribution, then we have an idea about what a chunk of data points might look like. To boot, these distributions also have nice mathematical properties that enable us to make generalizations about the ML models that consume those data as input. Even when we know little about the inner workings of a complex model, we can still say a lot about its expected performance and detect possible issues, like model bias, just by observing the distributions of input and output data.
Types of distributions
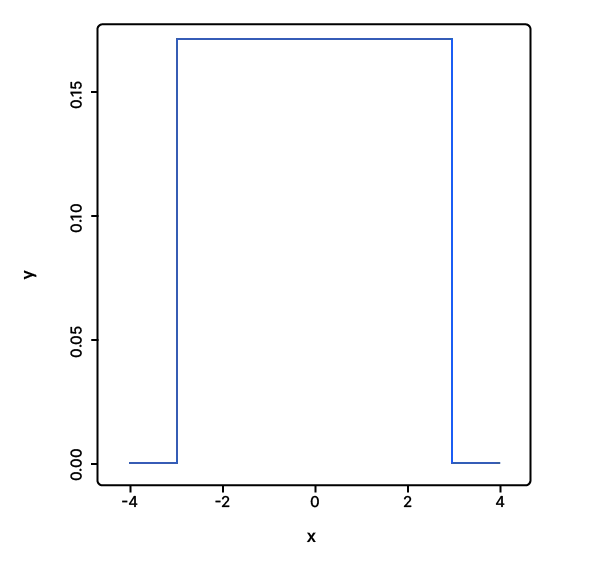
Uniform distribution is when the probability of obtaining a certain piece of data is identical to any other. A dice throw is an example of uniform distribution, where the probability of getting a ‘two’ is the same as getting a ‘six’.
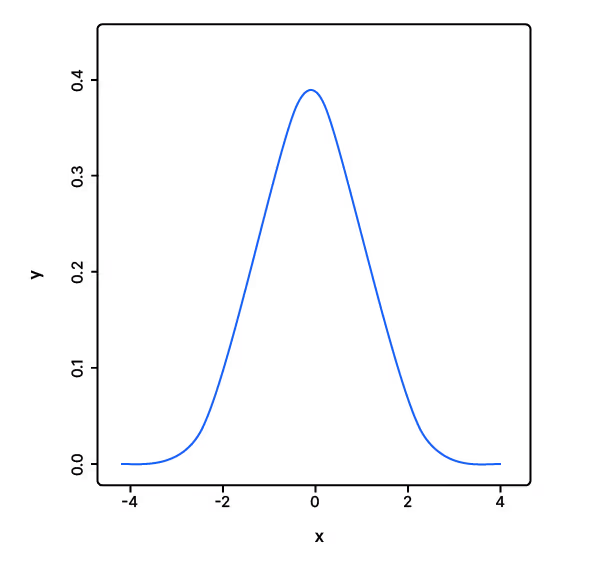
Normal or Gaussian distribution is when the highest probability occurs at a certain central point, and the probability of getting data at extreme ends decreases rapidly.
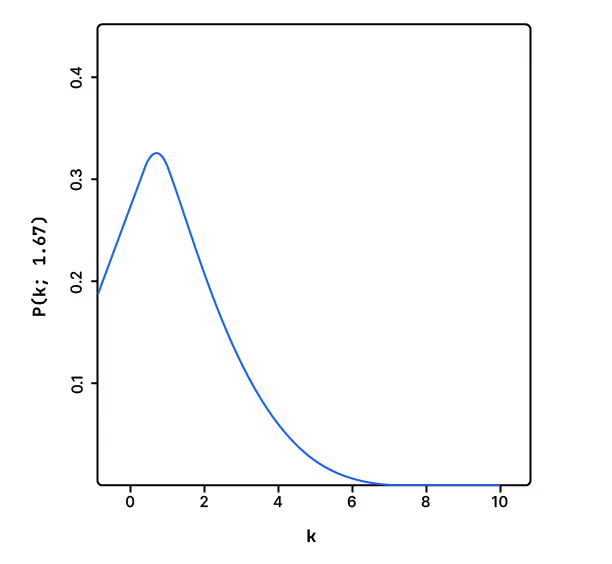
Poisson or Exponential distributions are used to model stochastic processes such as the number of visitors over a certain time period or the failure probability of a product.
Because we are making predictions based on our assumption of a certain statistical distribution of input and output data, we can detect model issues from a drift in those distributions. Monitoring these unexpected changes and measuring the extent of the change is critical to ensuring consistent model performance. Model drift metrics are just that — measures of such drift — that enable us to quantify the change in model behavior. There are primarily four different drift metrics.
Types of drift metrics
The four main types of model drift metrics vary in how they’re calculated, their application, and their use case. They are:
- Kullback-Leibler Divergence
- Jensen-Shannon Divergence
- Population Stability Index
- Chi-Squared Test
Read our whitepaper on how to measure ML model drift to understand the differences between these metrics, when to use one over the other, and how to measure drift in your models.