
Explainable AI, a topic of research until recently, is now mainstream. Recent research has enabled insights into the behavior of inherently black box AI models that can address its otherwise significant business risks related to bias, compliance and opaque outcomes.
However, many platforms and solutions provide these explanations either with flat numbers via API or with basic data visualizations both of which are not suitable for business users. Creating a product design that uses explainability to simplify AI and provide meaningful insights for the entire team is a challenging problem.
At Fiddler, we aspire to create universal user experiences anchored in cutting edge research and scalable infrastructure. Our product design streamlines business decisions with interfaces that are not only intuitive and interactive but also highly responsive.
We worked closely with our customers to iterate through several design versions to create our patented business-focused explanation design seen below. Here is our sample explanation for a high-risk loan prediction made by a tabular lending AI model.

Let’s walk through the numbered highlights below to understand how this design helps to explain this AI prediction and make AI explainable.

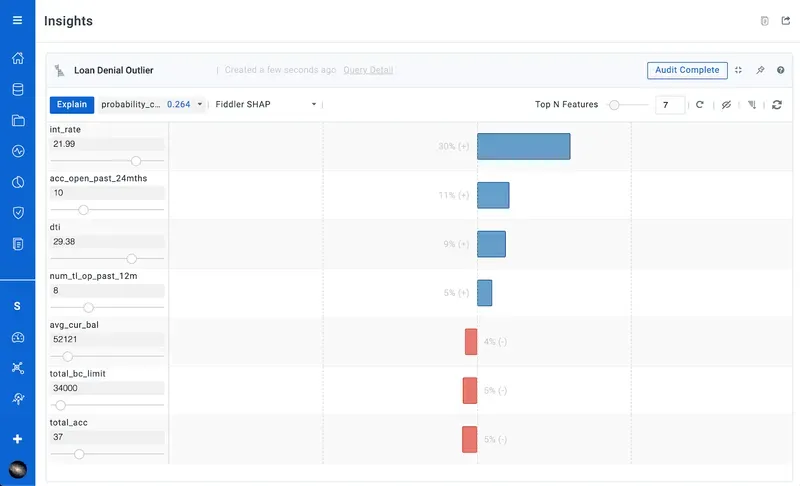
(1) The prediction probability that we’re trying to explain (in this case, 0.264 made for a high-risk loan) is highlighted in the important top left side of the screen. Multi-label predictions can also be intuitively supported with this dropdown.
(2) To its right, is the type of explanation being viewed. This example is using Fiddler’s scalable Shapley value algorithm. Other algorithms like ‘Integrated Gradients’ are easily accessible here.
(3) Next, you see the list of input values to the model for this prediction that include both continuous and categorical inputs. The slider location provides the value of this input to help understand its context within the entire dataset.

User friendly visualization guides


(4) We showcase the Shapley values themselves using a tornado plot visualization. “?” helps business users to understand how to use this visualization. Another visualization option explored was the waterfall plot which tested as a less intuitive approach. For text models, we use a similar plot that outlines the word-level impact and allows scenario analysis by removing or adding words to easily understand the keywords that impact the prediction.
(5) Models can generally have tens or even hundreds of inputs. Quick filters bubble up the top positive and negative impact inputs so users can focus on the important ones.
(6) A common next step is to change some input values and view the corresponding change in the model prediction. This is known as counterfactual analysis or ‘What-if’ scenarios. Sliders and dropdown quickly allow users to test out new input values to better understand the model and build trust with its mechanics.
(7) The user would then explain this new counterfactual scenario to see the new Shapley value impacts and compare them with the previous ones. This realtime interaction is made possible by running the Shapley algorithm using 150k model predictions all in a near sub-second latency.
(8) Risk and fraud operations generally work on a smaller set of flagged model predictions. Auditing predictions helps to quickly surface ones that they might not agree with so that these can be addressed by the data science team.
(9) These explanations along with other visualization can be compiled and pinned to dashboards so that others on the team can collaborate in the process
(10) Individual explanations can also be easily shared with other businesses, operations, risk and data science stakeholders.
All these components of the explanation user experience come together to provide an intuitive business-friendly solution to understanding AI technologies. Fiddler’s latest Analytics capability, Slice and Explain, builds on top of this prediction explanation to provide a powerful comprehensive explanation package.