Custom charts and rich dashboards gives MLOps teams the model intelligence and analytics to improve model performance, measure model metrics, and deliver high-performing AI outcomes.
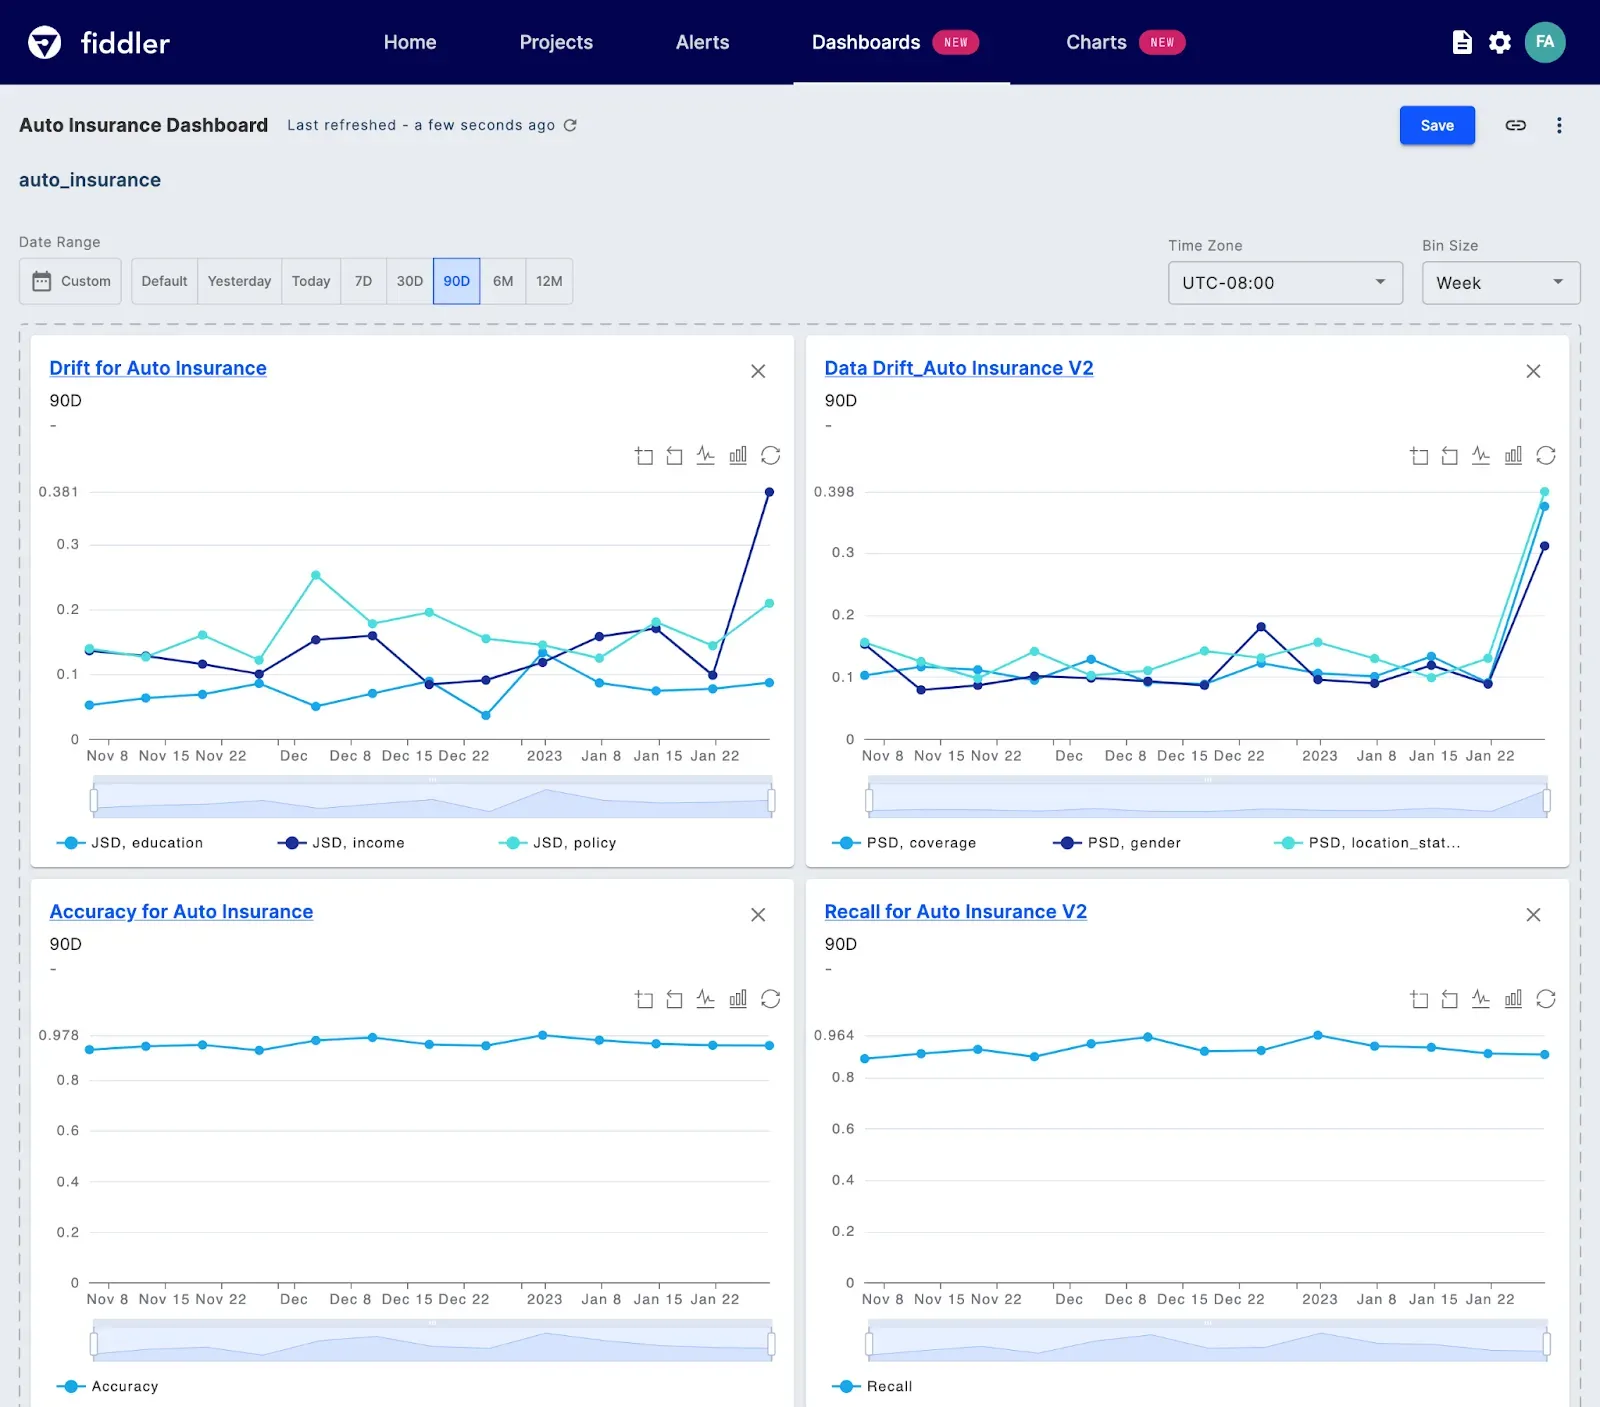
As a collection of shareable reports, custom dashboards break down silos and empower data scientists, ML practitioners, and business teams to track model health and boost model performance for better business outcomes. Cross-functional teams can visualize real-time model insights and measure how model performance impacts AI outcomes over time — all in a unified dashboard.
Develop a Deep Understanding of Model Behavior
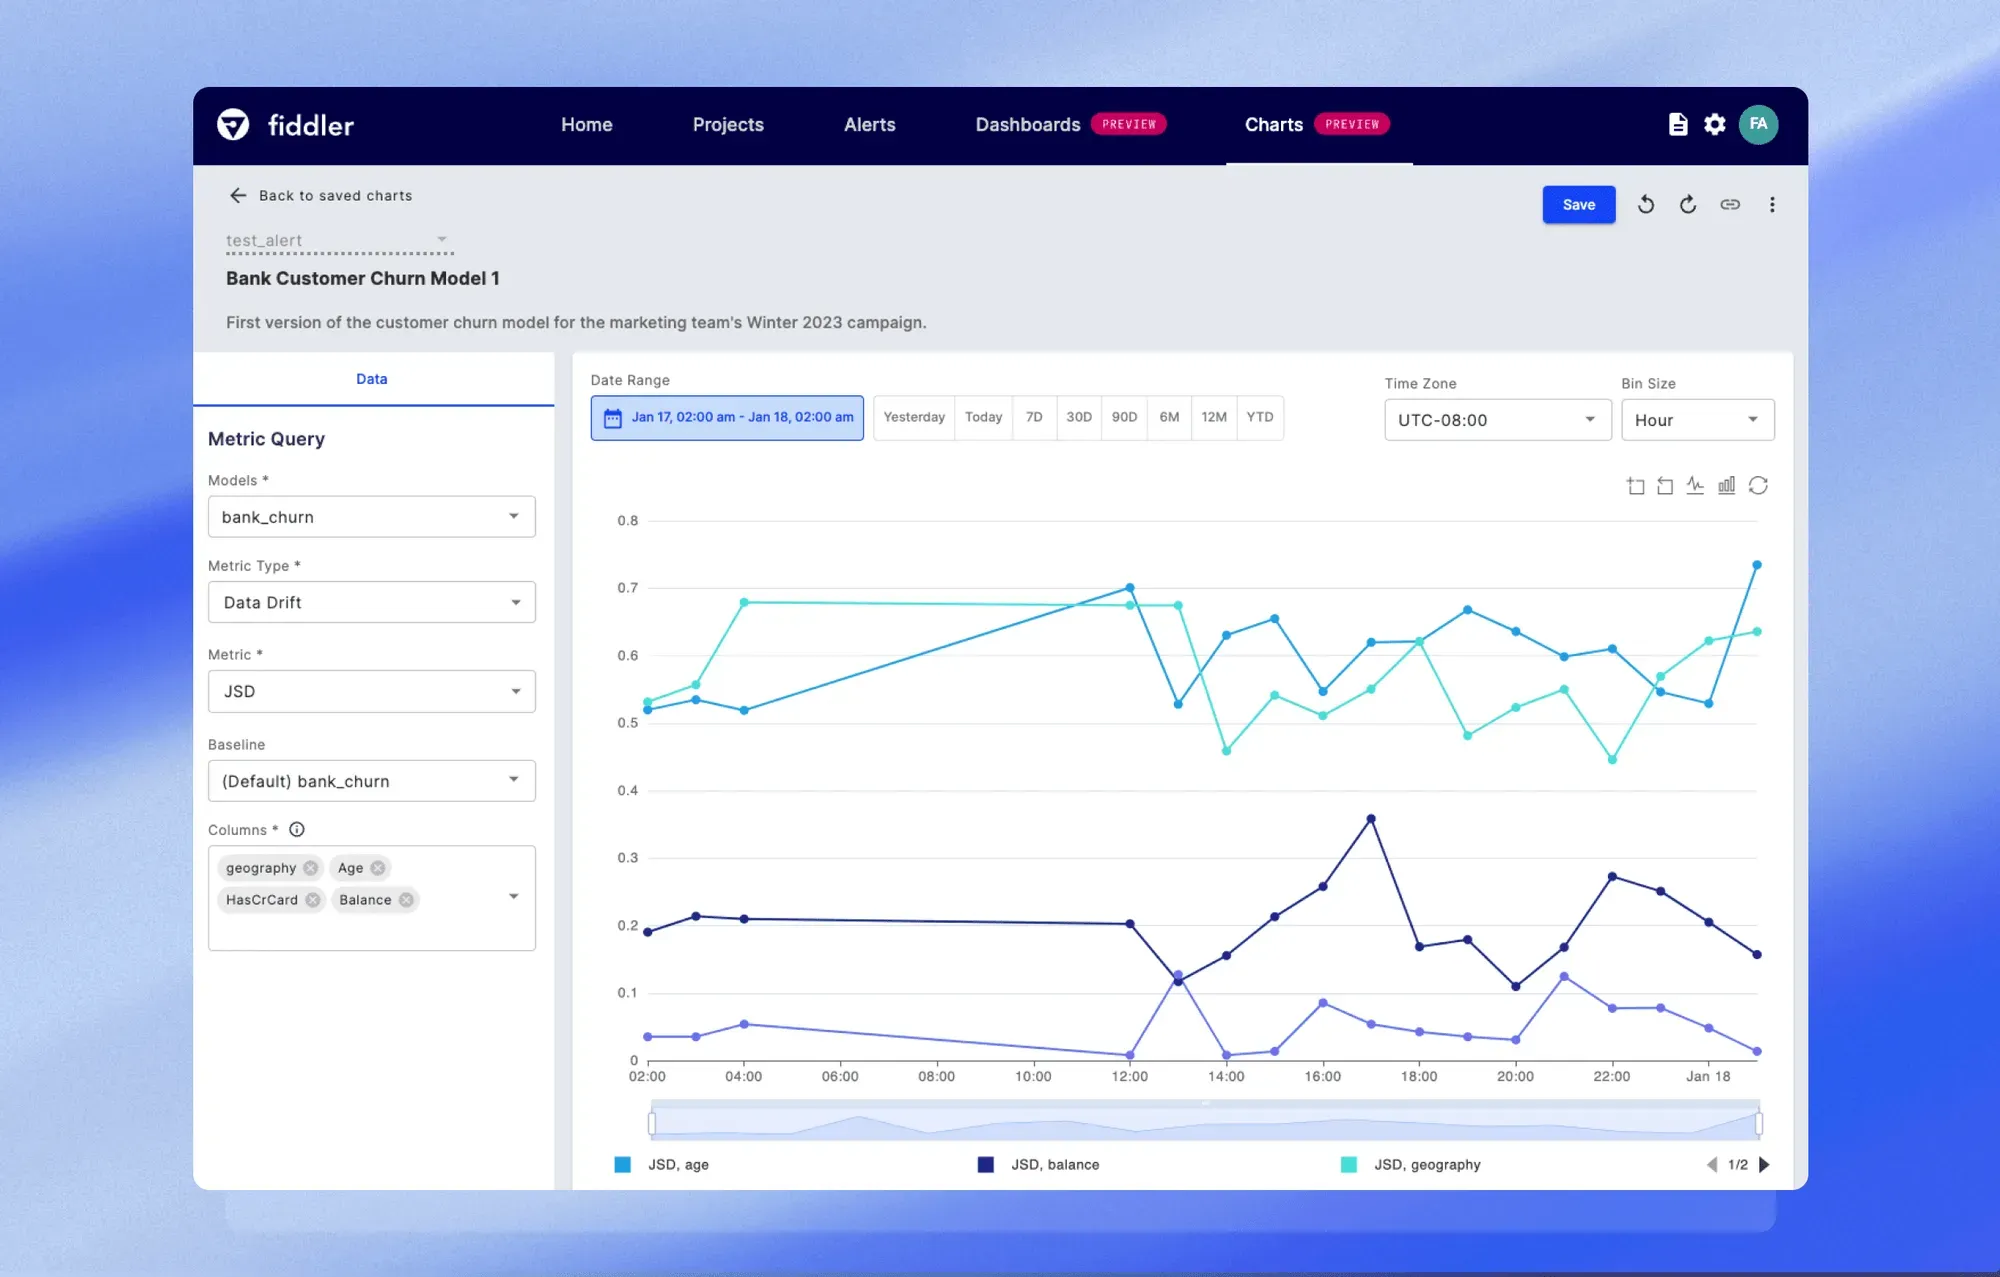
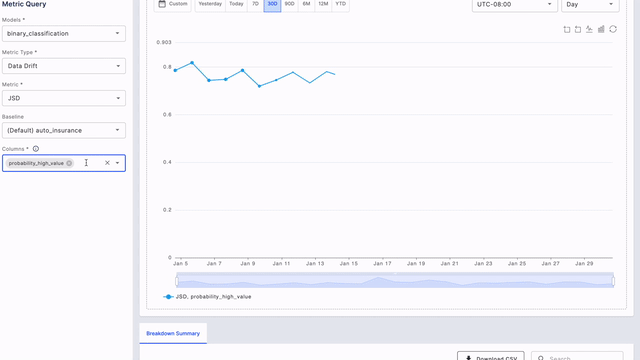
A model's performance can be adversely affected by various factors, including drift in feature distributions, and data integrity issues, like missing feature values or range mismatches originating in upstream data pipelines. By plotting these metrics on the same chart, you gain a more comprehensive understanding of the drivers of change. This allows you to draw insightful conclusions regarding how new model inputs or features can influence model performance and predictions.
Flexible and custom charts help you:
- Build custom reports to gain model insights and combine them in dashboards
- Overlay multiple metrics on a single chart to gain a deeper understanding of how complex real-world changes impact model performance and behavior
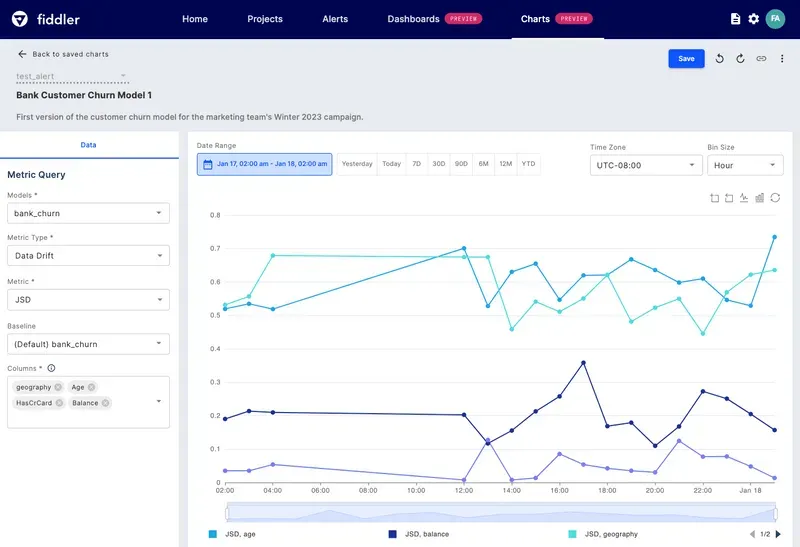
- Plot as many as 6 metric queries and up to 20 columns, including features, predictions, targets, and metadata, all in a single chart
- Get an in-depth view of your models for a specific date range, and zoom in to analyze drift for a particular time range within those dates
- Diagnose the root cause of model issues, or export a summary breakdown of the columns for interoperability and data exploration using other tools in your ML stack
The Value for ML and Data Science Teams
Together, custom dashboards and charts enable you to:
- Collaborate cross-functionally to improve business decision-making and ensure ML initiatives achieve business KPIs
- Track the overall health of models and have complete visibility into model performance
- Track post-production metrics against metrics used in the pre-deployment phases
- Perform 'Champion vs. Challenger' comparisons, analyzing models side by side to identify the more performant model for a particular business application
- Compare the model performance at different points in time
- Identify and receive model monitoring alerts by comparing production data over time against a variety of reference options, including static datasets and rolling baselines
- Improve model governance with the ability to share dashboards and reports with model validators and external regulators
Want to improve your model performance? Request a demo today!