

Key Takeaways
- GitHub Copilot natively exports OpenTelemetry data, and Fiddler ingests it directly. Setup takes three environment variables, with no SDK to embed and no custom collector to build.
- Copilot telemetry in Fiddler covers prompts, responses, tool calls, token usage, models invoked, and repo and branch context, giving teams visibility into what agents are actually doing across thousands of developer seats.
- Fiddler turns that telemetry into answers for the three questions every technical leader owes their board. Are we spending well, are we exposed anywhere, and is the investment paying off?
- Fiddler Centor Models detect secrets, PII, and unsafe prompts in your environment with no external API calls, eliminating the Evaluation Trust Tax that other platforms pass on with every evaluated trace.
- Fiddler Semantic Mappings handle non-standard OTel attributes from any third-party tool, so integrating Copilot alongside agents like Claude Code, LangGraph, and LiteLLM feeds one Control Plane view.
The Visibility Challenge with GitHub Copilot
Enterprises have spent years rolling out GitHub Copilot at scale, often across thousands of developer seats, with almost no corresponding visibility into what happens after a developer opens a session. Seat counts and license invoices tell leadership how many people have access; they say nothing about what the tool is being used for, on what codebases, or what the agent did once given a prompt.
That blind spot used to be tolerable when Copilot was mostly autocomplete, but agent mode changes the risk profile entirely. It plans multi-step tasks, calls tools, reads and writes files, and executes commands, often with a single human glancing at the output rather than reviewing each step. Without visibility into that activity, engineering leaders can't answer basic operational questions. How much is the tool actually being used? Is token spend proportional to the value being generated? Did a given session touch a sensitive repository?
Security and compliance teams face a sharper version of the same problem: a developer pasting a credential or customer record into a prompt, or an agent echoing one back in a response, leaves no trace anyone would see until it turns up somewhere it shouldn't, like an audit, a leaked-secrets scan, or a breach disclosure. In practice, "we have Copilot deployed" and "we know what Copilot is doing" have been two very different statements — closing that gap has been a major challenge, and many enterprises have simply gone without any real solution for it.
The Solution: AI Control Plane for Coding Agents
This is why Fiddler connects directly with GitHub Copilot's native OpenTelemetry (OTel) export to power dashboards and observability monitoring. Engineering and platform teams can automatically stream their Copilot agent activity into Fiddler in a standardized format: no SDK to embed, no custom collector to build, no waiting on a vendor roadmap.
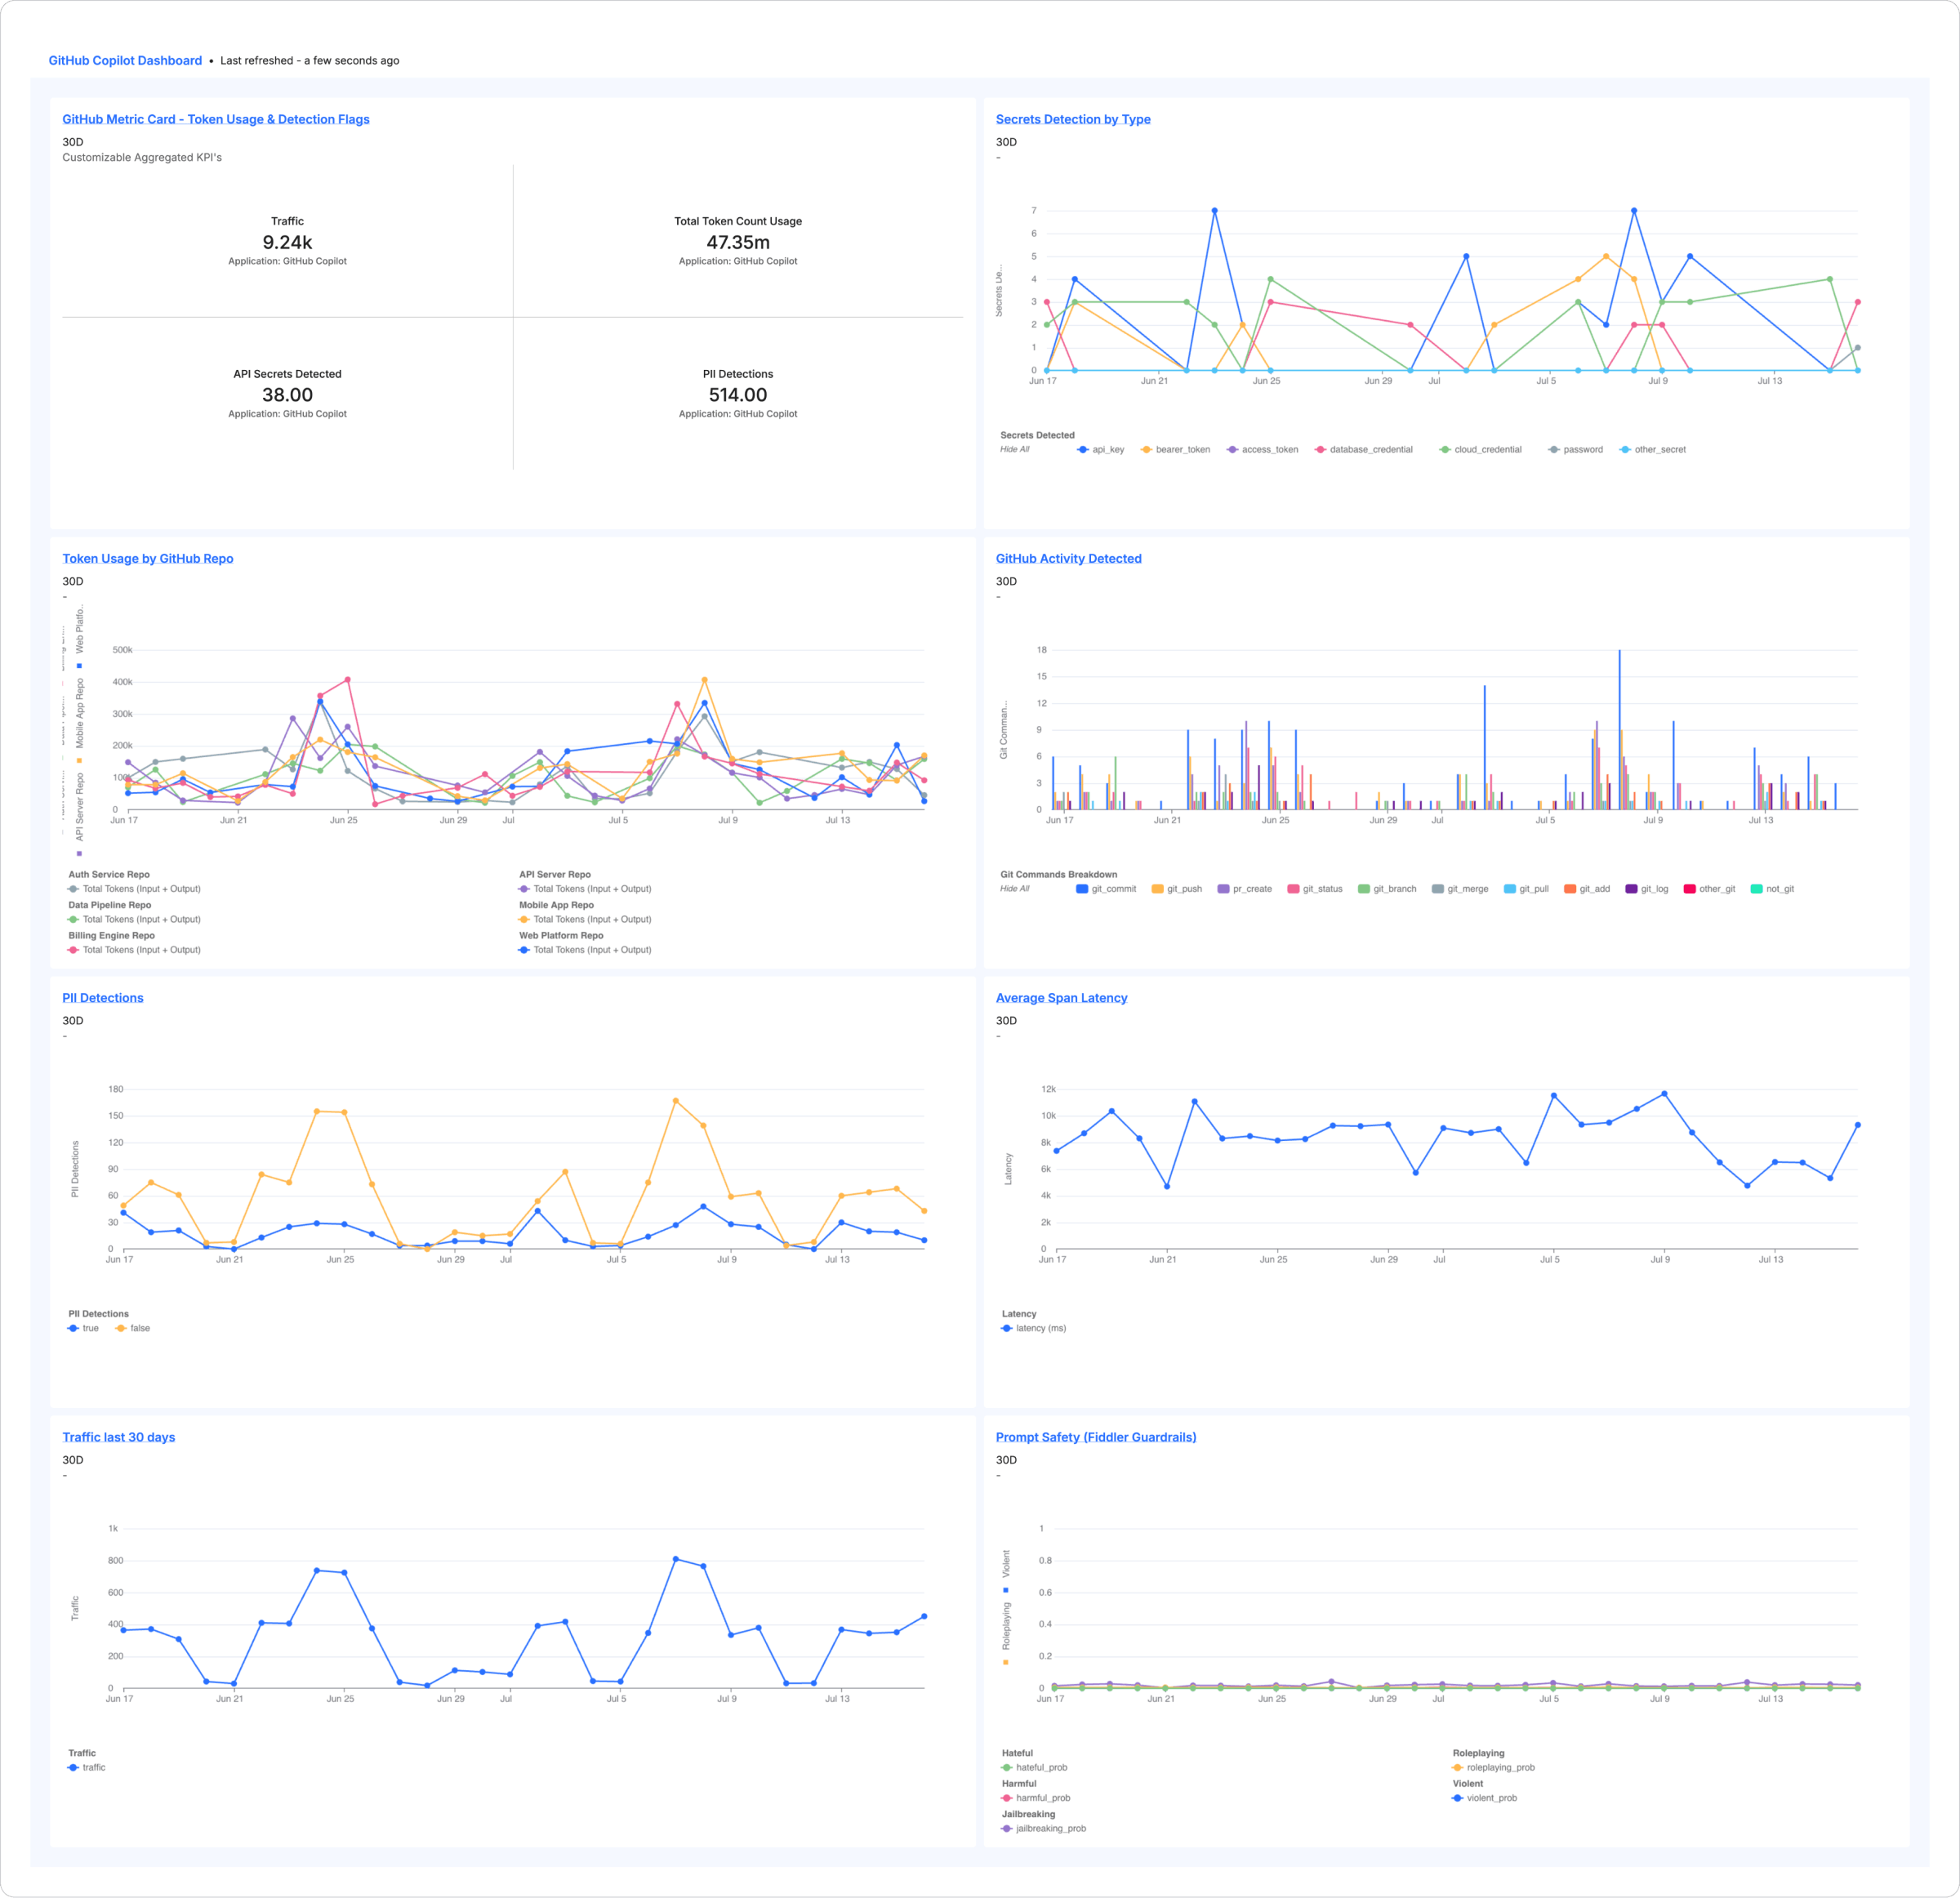
The OTel activity exported carries real substance: prompts, responses, tool calls, token usage, models invoked, session duration, repository and branch context, and more, flowing straight into Fiddler dashboards and visualizations the moment you point Copilot at Fiddler's OTLP endpoint.
This observability connection helps solve many challenges that arise across the enterprise as they use coding agents like Copilot, including:
Cost Tracking
Token usage at agent scale doesn't grow linearly, and costs can easily scale out of proportion when left unmonitored. Fiddler automatically tracks token usage across Copilot sessions, and can break this out in granularity within Fiddler charts/dashboards (i.e. by model used or GitHub repo / branch), by leveraging Fiddler's attribute-level filtering. Fiddler also provides insights into the prompt caching Copilot uses to help users save costs.
Monitoring that spend shouldn't create new spend of its own, though that's exactly what happens on most platforms. Most rely on external LLM calls for LLM-as-a-Judge evaluations, so every trace you evaluate incurs its own tokenization costs, a hidden expense we call the Evaluation Trust Tax. Fiddler Centor Models run in your environment with no external API calls, powering Guardrails and Evaluations at a fraction of the cost. You can estimate the difference for your own deployment with the Evaluation TCO Calculator.
Risk Monitoring
Coding Agents are actively becoming more widely used, which leads to more developer prompts that are connected to sensitive information, codebases, and internal databases. API keys can mistakenly get pasted into prompts while debugging, and sensitive customer information can get echoed back by the agent as these tools are repeatedly used throughout the day without much oversight. With Copilot activity now able to be streamed into Fiddler, customers can leverage Fiddler Centor Models that provide detection of developer Secrets / Credentials, PII / PHI, Hallucination, and Prompt Safety / Jailbreaks, enabling customers to achieve ongoing monitoring and alerting in the platform.
ROI and Productivity Visibility
Adoption numbers and seat counts tell leadership what they paid for. They don't tell them whether the thousand licenses they bought are producing value that justifies the spend per seat. Fiddler not only surfaces standard metrics such as session latencies and token usage, but also offers customizable evaluators to let customers define their own metrics on top of the telemetry provided by Copilot, such as agent response quality, developer prompting quality, frustration signals within a session, or git and PR activity volume over time. These metrics can be benchmarked against usage costs to support leadership in arriving at a defensible ROI measure for their Copilot investment, grounded in real usage data rather than anecdotes.
These are the same questions every technical leader already has to answer for their own board and audit committee. Are we spending well? Are we exposed anywhere? Is the investment actually paying off? Users can now leverage Fiddler to ingest Copilot logs at scale and customize dashboards around ROI, KPIs, and metrics that matter most to their teams.
Instructions to Connect Copilot to Fiddler
1. Set your Fiddler connection details. In a terminal, set the following (swap in your own endpoint, token, and application ID):
export COPILOT_OTEL_ENABLED=true
export OTEL_EXPORTER_OTLP_ENDPOINT="https://your-instance.fiddler.ai"
export OTEL_EXPORTER_OTLP_HEADERS="authorization=Bearer <YOUR_ACCESS_TOKEN>,fiddler-application-id=<YOUR_APPLICATION_UUID>"
export OTEL_RESOURCE_ATTRIBUTES="application.id=<YOUR_APPLICATION_UUID>"
export COPILOT_OTEL_CAPTURE_CONTENT=true
(Windows PowerShell users: replace export VAR=value with $env:VAR="value" for each line.)
2. Launch VS Code from that same terminal session so it inherits the variables:
code .If the code command isn't recognized, open VS Code manually, open the Command Palette (Ctrl+Shift+P / Cmd+Shift+P on macOS), run Shell: Install 'code' command in PATH, then restart your terminal and try again.
3. Open the Copilot Chat window (Ctrl+Alt+I on Windows/Linux, Ctrl+Cmd+I on macOS) and start prompting.
That's it. Copilot activity is sent to Fiddler to power observability across tool calls, LLM calls, token usage, and a wide variety of additional metadata such as models used, errors, caching activity, and GitHub repository/branch details as you run the Copilot application.
Fiddler Semantic Mappings to Support Various OTel Formats
Copilot's OTel export follows the OTel GenAI Semantic Conventions including several standard attributes widely used today. With that said, there is no standard OTel format convention across third party agentic platforms today, causing wide variation of attribute names. That's normally where an integration turns into a mapping project before it can be ingested properly. To help support the wide variety of third party applications and tools enterprises use today, Fiddler has recently introduced Semantic Mappings, allowing customers to pass in OTel attributes that do not fit within standardized formats, and map them to the proper attribute directly within the Fiddler UI. This allows flexibility in the OTel that is passed in from third party tools such as Copilot, whether or not the output follows a standard convention.
Every Copilot Session, One Control Plane
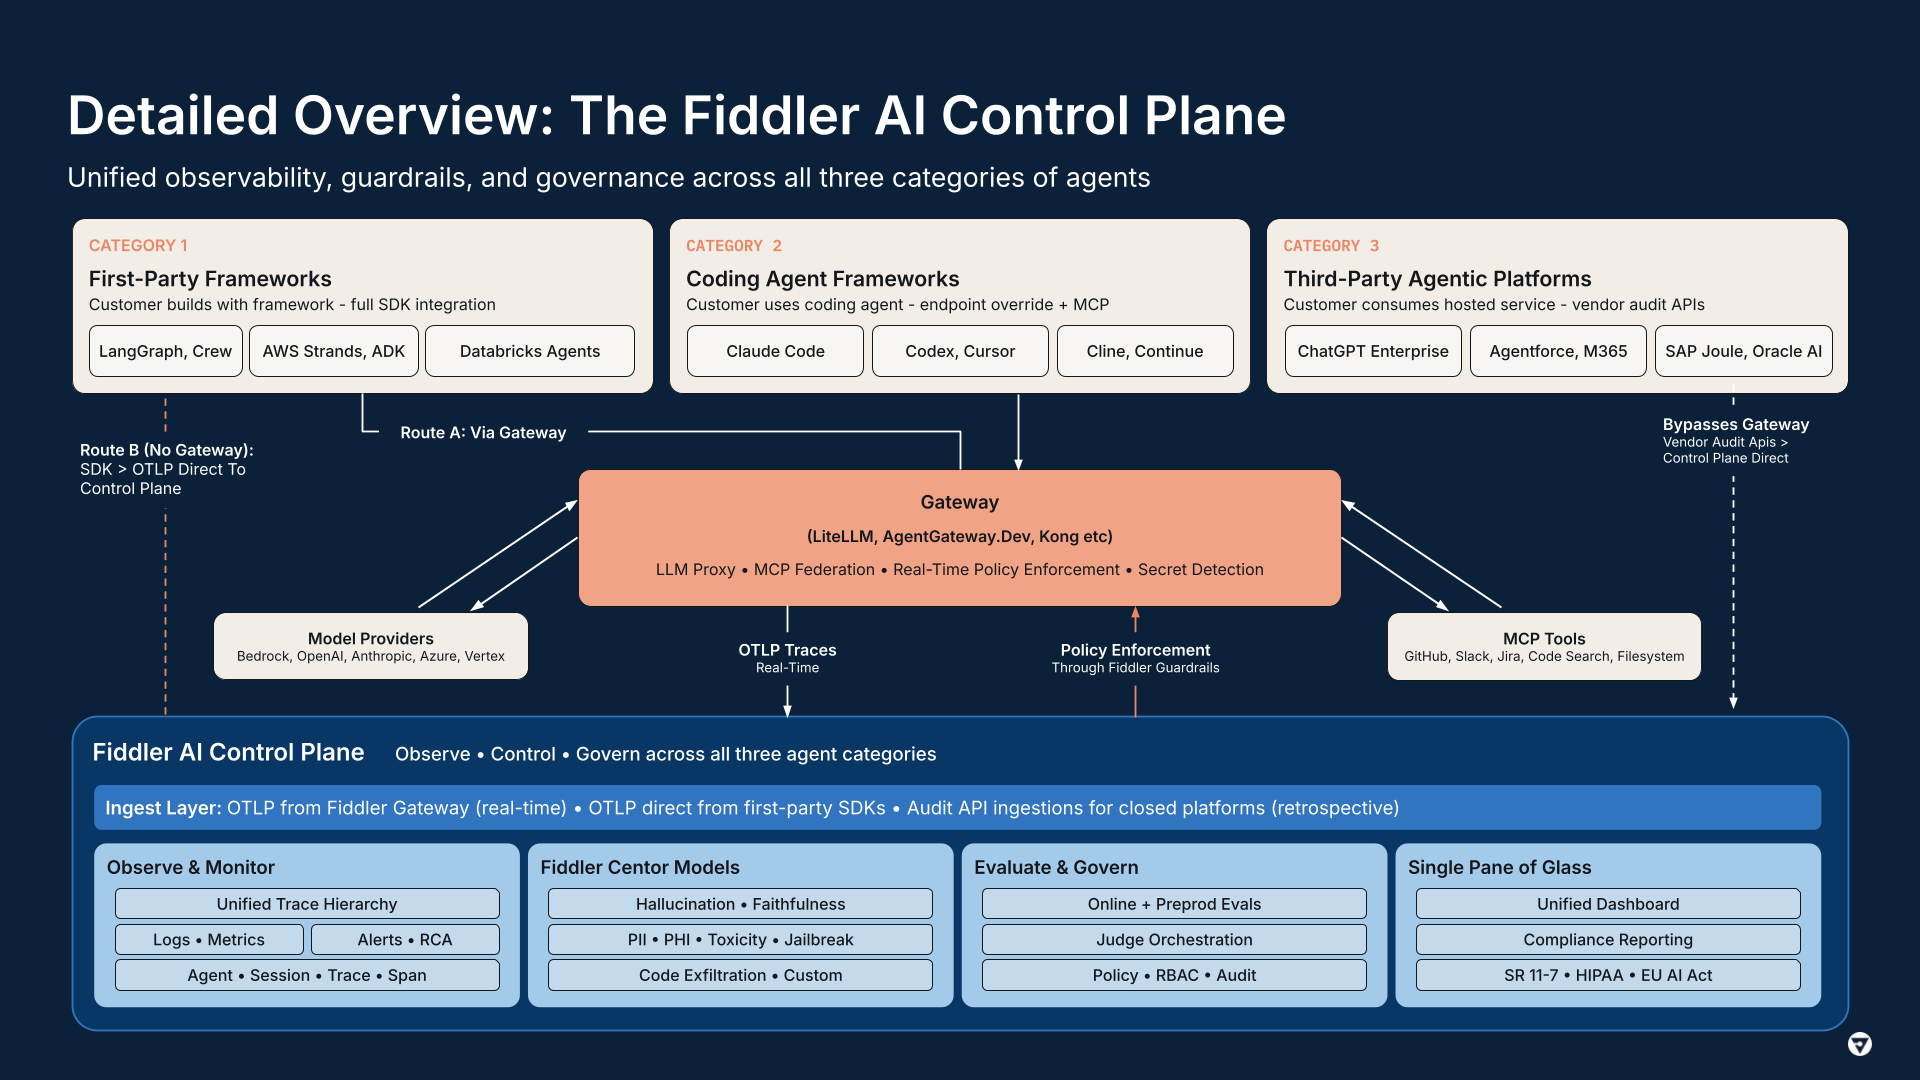
The industry is continuing to converge around OpenTelemetry as the standardized framework powering Agentic Observability. Fiddler leverages OpenTelemetry to power several built-in integrations including with agentic development tools (e.g. LangGraph and Strands), AI gateways (e.g. Kong and LiteLLM), and coding agent tools (e.g. Claude Code and OpenCode). Because Fiddler seamlessly ingests standard OpenTelemetry data, integrating Copilot along with these diverse agentic platforms into the Fiddler Observability and Security platform is easier than ever.
This integration builds on the story we laid out in Fiddler AI Control Plane for Coding Agents, where we made the case that observability must precede autonomy. Fiddler ingests Copilot telemetry to give you visibility into every session, tool call, and token spent, one layer of the full Control Plane alongside LLM Gateways, Guardrails, Policy Enforcement, Alerting and Executive Dashboards that enterprise AI teams are prioritizing today. One place to see every agent, evaluate every action, and enforce policy before data ever leaves the network.
Ready to see your Copilot sessions in Fiddler? Request a demo and we'll help you get connected.
References
Microsoft, "Monitor agent usage with OpenTelemetry," Visual Studio Code Documentation, May 28, 2026. [Online]. Available: https://code.visualstudio.com/docs/agents/guides/monitoring-agents.
OpenTelemetry, "OpenTelemetry GenAI Semantic Conventions," GitHub repository. [Online]. Available: https://github.com/open-telemetry/semantic-conventions-genai.
Frequently Asked Questions
How do I connect GitHub Copilot to Fiddler?
Set three environment variables in your terminal (the OTLP endpoint, your access token, and your application ID), launch VS Code from that session, and start prompting in Copilot Chat. Copilot's native OpenTelemetry export streams activity to Fiddler automatically. There is no SDK to embed and no custom collector to build. For persistence, add the variables to your shell configuration file.
What Copilot data does Fiddler capture?
Fiddler ingests the telemetry Copilot exports through OTel, including prompts, responses, tool calls, token usage, models invoked, session duration, error types, caching activity, and GitHub repository and branch context. This powers dashboards for cost tracking, risk monitoring, and productivity analysis.
Does my Copilot data leave my environment?
No. Telemetry flows only to the Fiddler endpoint you configure, staying within your own environment or VPC. Fiddler supports single-tenant SaaS, on-premises, and air-gapped deployments, and is SOC 2 Type 2 certified.
Can Fiddler detect when a developer or agent exposes sensitive data in a Copilot session?
Yes. Fiddler Centor Models detect secrets and credentials, PII and PHI, hallucinations, and prompt safety issues like jailbreaks, with ongoing monitoring and alerting. Because Centor Models run in your environment with no external API calls, these evaluations avoid the per-trace costs of external LLM-as-a-Judge approaches. You can estimate the difference with the Evaluation TCO Calculator.
What if my other agent tools don't follow standard OTel conventions?
Fiddler Semantic Mappings let you map non-standard OTel attributes to the proper fields directly in the Fiddler UI. That means Copilot, Claude Code, LangGraph, Kong, LiteLLM, and other agentic tools can all feed one Control Plane view regardless of how their exports are formatted.